Judgment and Decision Making, Vol. 14, No. 2, March 2019, pp. 156-169
The link between intuitive thinking and social conservatism is stronger in WEIRD societies
Onurcan Yilmaz*
Sinan Alper#
|
While previous studies reveal mixed findings on the relationship between
analytic cognitive style (ACS) and right-wing (conservative) political
orientation, the correlation is generally negative. However, most
of these studies are based on Western, educated, industrialized, rich,
and democratic (WEIRD) societies, and it is not clear whether this
relationship is a cross-culturally stable phenomenon. In order to test
cross-cultural generalizability of this finding, we re-analyzed the data
collected by the Many Labs 2 Project from 30 politically diverse
societies (N = 7,263). Social conservatism is measured with the
binding foundations scale, comprising of loyalty (patriotism), authority
(respect for traditions), and sanctity (respect for the sacred), as
proposed by the moral foundations theory, while ACS is measured by the
three-item modified cognitive reflection task. The level of WEIRDness of
each country was calculated by scoring how much a culture is Western,
educated, industrialized, rich, and democratic. Although social
conservatism is negatively associated with ACS in the aggregate, analysis
indicates that the relationship is significantly stronger among WEIRD and
remains negligible among non-WEIRD cultures. These findings show the
cross-cultural variability of this relationship and emphasize the
limitations of studying only WEIRD cultures.
Keywords: analytic cognitive style, cognitive reflection test, social conservatism, ideology, liberalism, WEIRD, cross-cultural stability, moral foundations
1 Introduction
Are analytical thinkers less likely to be conservative across the globe?
To answer this question, a series of recent studies conducted in different
cultures have examined whether there is a difference in cognitive style
(analytic vs. intuitive) between left and right-wing ideologies (Brandt,
Evans & Crawford, 2015; Deppe et al., 2015; Eidelman, Crandall, Goodman,
& Blanchar, 2012; Iyer, Koleva, Graham, Ditto & Haidt, 2012; Jost,
Sterling & Stern, 2018; Kahan, 2013; Landy, 2016; Piazza & Sousa, 2014;
Pennycook, Cheyne, Seli, Koehler & Fugelsang, 2012; Pennycook, Cheyne,
Barr, Koehler & Fugelsang, 2014; Saribay & Yilmaz, 2017; Sterling, Jost,
& Pennycook, 2016; Talhelm, et al., 2015; Talhelm, 2018; Van Berkel,
Crandall, Eidelman & Blanchar, 2015; Yilmaz & Saribay, 2016, 2017a,
2017b, 2017c, 2018a).1
While some studies found a negative relationship between a performance
measure of analytical cognitive style (ACS) as represented by the Cognitive
Reflection Test (CRT; Frederick, 2005) and a single item political
orientation question (ranging from extremely liberal to extremely
conservative; Deppe et al., 2015; Pennycook et al., 2012; Iyer et al.,
2012; Talhelm et al., 2015; Yilmaz & Saribay, 2016), others failed to find
any relationship (Kahan, 2013; Landy, 2016; Piazza & Sousa, 2014; Yilmaz
& Saribay, 2017c). The mixed findings in the literature raise the question
whether this relationship is stable across cultures. In particular,
although the ACS and ideology link is generally stable in Western samples
(Jost et al., 2018), the findings regarding this relationship are not
always consistent in non-Western cultures (e.g., Bahçekapili & Yilmaz,
2017; Yilmaz & Saribay, 2018a). Consistent with these correlational
studies, experimental research also produced mixed findings: Eidelman et
al. (2012) — with very low sample sizes — showed that the activation of
intuitive thinking leads to conservatism in three different experiments in
WEIRD samples (i.e., the US). However, two of these studies could not be
replicated in non-WEIRD samples (i.e., Turkey) in high-powered attempts
(Yilmaz & Saribay, 2016, 2018b). We argue that the link between cognitive
style and social conservatism may be cross-culturally variable, which would
explain at least some of the mixed findings in the literature. Therefore,
relying on data from 30 politically diverse societies, this study provides
a test whether the link between ACS and ideology is a cross-culturally
stable phenomenon.
1.1 Toward a Cross-Culturally Valid Measure of Political
Orientation
Although the single item political orientation question was previously
considered a reliable method for measuring ideology (Jost, 2006), Iyer
et al. (2012) emphasized the confounding role of libertarians.
Liberterians place themselves on the conservative side of the
left-right (or liberal-conservative) spectrum when one-item political
orientation question is used. At the same time, the libertarians have
higher ACS scores than liberals and conservatives. Therefore, the
one-item political orientation question has important limitations, and
cannot be reliably used in cross-cultural research to investigate the
link between ACS and ideology.
In other studies, the two dimensions of conservative ideology, namely
social and economic conservatism, were measured separately to overcome
the limitations of the one-item measure. Jost et al. (2018), for
example, conducted a meta-analysis and found that ACS (as measured by
CRT) is correlated with social conservatism (r = −.15) and
that the correlation between ACS and economic conservatism is weaker
(r = −.08). The same moderating effect was evidenced in
subsequent studies using different measures of ACS and ideology on
American participants (Yilmaz & Saribay, 2017c).
However, it is not clear whether the categories of social and economic
conservatism provide a valid and useful distinction outside of the
United States. The conservatism-as-motivated-social-cognition approach
provides a better alternative to measuring ideology based on
culture-free characteristics of the ideology (Jost, Glaser, Kruglanski
& Sulloway, 2003). This approach defines ideology as comprised of two
relatively independent motives: Resistance to change and opposition to
equality, corresponding to social and economic conservatism in the US
political context. These motives behind political conservatism are
thought to be a defensive reaction, and serve to reduce the tension
created by uncertainty and existential threat. CRT showed a significant
negative relationship with only one of those motives, resistance to
change, whereas it did not show any significant relationship with
opposition to equality (Yilmaz & Saribay, 2018a). Therefore, measuring
ideology by focusing on resistance to change rather than the one-item
general or social conservatism questions can be a more insightful and
cross-culturally appropriate approach for testing whether the
relationship between ACS and ideological orientation is
cross-culturally stable.
Jost et al. (2003) argue that these two motives are universal. However,
there are reasons to question whether ACS is related only to social
conservatism (among other ideology measures), and whether this
relationship holds cross-culturally. Although Yilmaz and Saribay
(2017a, 2017b) found a causal effect of ACS on ideology, this finding
does not directly correspond to the distinction between social and
economic conservatism. In Yilmaz and Saribay’s (2017b) study conducted
in Turkey, binding moral foundations, which is a measure of social
conservatism, were not related to CRT, although they were found to be
related in American samples (Landy, 2016; Pennycook et al., 2014).
Besides, most research on this link has been conducted among American
participants (see Jost et al., 2018), although there are some
exceptions (e.g., Yilmaz & Saribay, 2016). Therefore, there is a need
for further cross-cultural investigation of this issue.
1.2 The Present Research
We argue that these mixed findings might be partially explained by
cross-cultural differences across the samples. In order to categorize
countries in terms of cultural differences, Henrich, Heine and
Norenzayan (2010) proposed the concept of WEIRD, which stands
for Western, educated, industrialized, rich, and democratic societies.
They claim that the samples commonly used in psychology studies are
mainly from WEIRD cultures, which represent only 15% of the world
population; and thus the samples in most psychology studies are biased
and not representative of the majority of the world population which is
predominantly non-WEIRD. Although Gervais et al. (2018) did not
directly test the moderating role of cultural WEIRDness, they recently
found a cross-cultural variability on the relationship between ACS (as
measured by CRT) and religious belief (as measured by one item
religious belief question), a related concept to social conservatism.
This suggests that the WEIRDness of the culture might have a moderating
role in the relationship between ACS and social conservatism.
| Table 1: List of CRT questions used in the current research. |
Question | Intuitive but Incorrect Answer | Correct Answer |
If it takes 2 nurses 2 minutes to measure the blood pressure of 2
patients, how long would it take 200 nurses to measure the blood
pressure of 200 patients? | 200 | 2 |
Soup and salad cost $5.50 in total. The soup costs a dollar more than
the salad. How much does the salad cost? | 2,50 | 2,25 |
Sally is making tea. Every hour, the concentration of the tea doubles.
If it takes 6 hours for the tea to be ready, how long would it take for
the tea to reach half of the final concentration? | 3 | 5 |
In this study, we evaluate whether the relationship between social
conservatism and ACS is cross-culturally stable using the large
cross-cultural dataset of the Many Labs 2 Project (Klein et al., 2018), and we
investigate the moderating role of the WEIRDness of the culture. We use the
binding subscale of the Moral Foundations Questionnaire developed by Graham
et al. (2011) in order to measure social conservatism. This questionnaire
was previously validated in several countries including WEIRD (e.g.,
Davies, Sibley & Liu, 2014; Métayer & Pahlavan, 2014; Nilsson &
Erlandsson, 2015) and non-WEIRD cultures (Berniūnas, Dranseika & Sousa,
2016; Yilmaz, Harma, Bahçekapili & Cesur, 2016a; Zhang & Li,
2015). Binding foundations are comprised of patriotism (loyalty), respect
for traditions (authority), and respect for the sacred (sanctity), and thus
it is actually a repackaging of the previous literature on social
conservatism (Federico, Weber, Ergun & Hunt, 2013; Jost, 2012; Kugler,
Jost & Noorbaloochi, 2014; Milojev et al., 2014; Sinn & Hayes, 2016). In
other words, while the individualizing foundations (corresponding to care
and fairness) negatively relates to opposition to equality, binding
foundations correspond to resistance to change (i.e., social conservatism;
Sinn & Hayes, 2016). In different studies conducted with American (Kugler
et al., 2014) and Swedish (Nilsson & Erlandsson, 2015) participants, the
relationship between the binding foundations and right-wing political
orientation is largely explained by variation in resistance to change
(i.e., social conservatism). In addition, Sinn and Hayes (2016) demonstrated
in a factor analysis study that binding foundations correspond to
resistance to change. More importantly, although the concept of social
conservatism can have different meanings in different cultures, binding
foundations represent an overall adherence to traditional moral values,
which is likely to be an important indicator of social conservatism across
different cultures (Graham et al., 2011). Therefore, in order to
operationalize social conservatism in a cross-cultural study, we used the
binding foundations measures for 30 politically diverse cultures. These
cultures include relatively non-WEIRD cultures such as Brazil, China,
Turkey, and India, and relatively WEIRD cultures such as Canada,
Switzerland, France, and Austria. Overall, we aim to determine the
direction and the magnitude of the relationship between ACS and social
conservatism across WEIRD and non-WEIRD cultures.
2 Method
2.1 Participants
We retrieved the data from Many Labs 2 Project (Klein et al., 2018), a
replication project with a total sample of 15,305 participants from 36
countries. The original research consisted of two groups of studies called
“slates”. The cognitive Reflection Test (CRT) was administered in both
slates but the Moral Foundations Questionnaire and the one-item ideology
measure were administered only in Slate 1. We hence only analyzed the data
of Slate 1, which included 7,263 participants from 30 countries.
2.2 Measures
Cognitive reflection test.
The cognitive reflection test
(CRT; Frederick, 2005) consists of three mathematical questions. There
are intuitive but incorrect answers to these questions. If one can
suppress the intuitive answer and give the correct answer, this is
considered an indicator of analytic thinking (e.g., Stagnaro,
Pennycook & Rand, 2018; Meyer, Zhou & Frederick, 2018). Many Labs 2
Project included three CRT questions (Finucane & Gullion, 2010; see
Table 1). We first cleaned the data by deleting any non-text characters
in participants’ responses. For example, some participants responded as
“2 minutes” or “$5”; in such cases, we deleted “minutes” and “$” to
make these variables available for statistical analyses. We also
removed invalid or meaningless responses (e.g., “I don’t care”). Then
we coded incorrect responses as 0 and correct responses as 1. Lastly,
we created an index score by summing up scores for these three
questions which resulted in a potential range from 0 to 3. Higher
scores indicate more analytic thinking. The Cronbach’s alpha score for
correct responses to these three items was .610.
Moral foundations questionnaire.
We measured social
conservatism based on scores on binding moral foundations. Moral
foundations questionnaire (Graham et al., 2011) employed in Many Labs 2
included three items for each of the five moral foundations (care,
fairness, loyalty, authority, and sanctity). Individualizing
foundations consist of care and fairness whereas binding foundations
consist of loyalty, authority, and sanctity. Both individualizing
(α = .822) and binding foundations (α
= .777) subscales had sufficient reliability. We report the results
regarding both individualizing and binding foundations, but we did not
have any a priori hypothesis on the relation between CRT and
individualizing foundations.
WEIRDness.
In Many Labs 2 (Klein et al., 2018), the level
of WEIRDness of each country was quantified by scoring each of the
components of WEIRD, namely Western (Western countries were rated as 1
whereas the others were rated as 0), Educated (rated based on the
Education Index retrieved from the United Nations), Industrialized
(rated based on the Industrial Development Report of the United
Nations), Rich (developed countries were rated as 1 whereas the
emerging economies were rated as 0), Democratic (democratization scores
were retrieved from the Global Democracy Ranking) (Klein et al., 2018;
more detailed information is available at https://osf.io/b7qrt/).
Thus they created a continuous scale for the level of WEIRDness of each
nation. They also split the countries into two categories: Those who
had higher than average WEIRDness scores were labeled as WEIRD samples
whereas those with lower than average scores were labeled as non-WEIRD
(Table 2).
Ideology.
Ideology was assessed using a single item “Please
rate your political ideology on the following scale” (1 =
strongly left-wing, 7 = strongly right-wing).
| Table 2: List of Non-WEIRD and WEIRD countries included in the sample (in
alphabetical order). |
Non-WEIRD countries | WEIRD countries |
Brazil, China, Costa Rica, Hong Kong (China), India, Japan, Mexico,
Serbia, South Africa, Taiwan (China), Turkey, UAE, Uruguay | Austria,
Belgium, Canada, Chile, Czech Republic, France, Germany, Hungary, New
Zealand, Poland, Portugal, Spain, Sweden, Switzerland, The Netherlands,
UK, USA |
| Note. These countries were included in Slate 1 of Many Labs 2
Project. The second question was revised for certain cultures by using
different currencies and amounts of money, although the required type of
calculation was essentially the same. The expected correct answers for each
country are listed in the Appendix.
|
We also considered using other measures to tap into the level of
WEIRDness of countries. Muthukrishna et al. (2018) recently developed a
scale to measure countries’ cultural distance to the United States
(WEIRD scale) and China (Sino scale). However, we decided to base our
analyses on the WEIRDness measurement employed by Many Labs 2
for two reasons: First, both WEIRD (r = −.739, p
< .001) and Sino scales (r = .717, p
< .001) were very strongly correlated with the WEIRDness
measure in Many Labs 2. We reasoned that these different scales are
tapping into the same construct. Second, Muthukrishna et al.’s (2018)
study does not provide scores for six countries included in the current
research (Costa Rica, United Arab Emirates, Czech Republic, Belgium,
Portugal, and Austria).
3 Results
We conducted meta-analyses to examine (1) the overall effect of CRT on
ideology, binding, and individualizing foundations, (2) and whether the
level of WEIRDness accounts for the differences between countries. We used
the meta-analysis function in JASP software (JASP Team, 2018) which is
based on metafor, a meta-analysis package for R (Viechtbaur, 2010). We
have utilized a fixed-effects method with moderators for the meta-analyses
by restricting our inferences regarding the results to the countries
included in the dataset (see Viechtbauer, 2010, for detailed discussion on
the different types of meta-analyses). However, the Appendix reports
analyses with a random-effects method (for foundations), which permits
generalization to the population of countries (and yields weaker results
consistent with the conclusions reported in the main text), and a
restricted maximum likelihood method (with fixed effects). These Appendix
also includes bivariate correlation tables.
3.1 The Effect on Ideology
The combined meta-analytic effect was statistically significant
(b = −.051, SE = .018, z = −2.813, p =
.005, 95% CI [−.086, −.015]). When continuous WEIRDness score was added
to the model as a covariate, neither the intercept (b = .002,
SE = .053, z = .045, p = .964, 95% CI [−.101,
.134]), nor WEIRDness as a covariate had a significant effect (b
= −.079, SE = .074, z = −1.079, p = .281,
95% CI [−.224, .065]). So, CRT was negatively related to right-wing
ideology and WEIRDness did not moderate this effect (Figure 1). However,
when a restricted maximum likelihood method was used, the meta-analytic
effect of CRT did not reach to statistical significance (see the
Appendix).
Lastly, we investigated which component of WEIRDness has stronger
moderating effects. In Many Labs 2 (Klein et al., 2018), separate scores
for each of the five components of WEIRDness (Western, educated,
industrialized, rich, and democratic) were provided. Instead of the mean
WEIRDness score, we added these covariates to the model. Only education had
a significant moderation effect (Table 3). Accordingly, CRT had a stronger
effect on having a right-wing ideology in countries with better education.
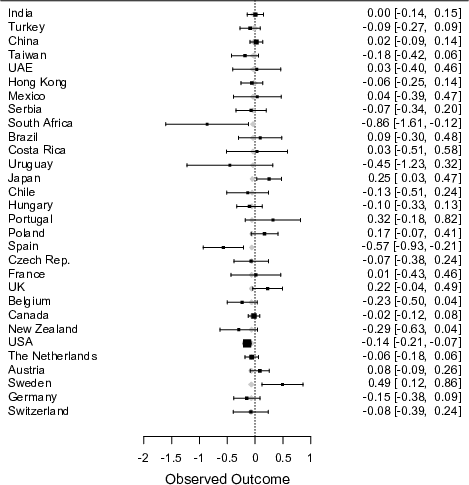
| Figure 1: The distribution of unstandardized regression
coefficients predicting ideology from CRT. Whiskers represent 95%
confidence intervals for the coefficients. Grey diamonds represent the
predictions from the level of WEIRDness. Countries are ranked based on
their mean WEIRDness scores with India being the least WEIRD and
Switzerland being the most WEIRD nation. |
| Table 3: Estimates for the Effect of Different Components of WEIRDness on
Ideology. |
| | b | SE | z | p | 95% CI |
| Intercept | 0.270 | 0.247 | 1.094 | 0.274 | -0.214 | : | 0.754 |
| Western | -0.100 | 0.075 | -1.343 | 0.180 | -0.247 | : | 0.046 |
| Educated | -0.787 | 0.360 | -2.189 | 0.029 | -1.492 | : | -0.082 |
| Industrial | 0.074 | 0.124 | 0.599 | 0.549 | -0.169 | : | 0.318 |
| Rich | 0.181 | 0.099 | 1.830 | 0.069 | -0.014 | : | 0.375 |
| Democratic | 0.291 | 0.316 | 0.920 | 0.358 | -0.329 | : | 0.910 |
3.2 The Effect on Binding Moral Foundations
The combined effect was significant (b = −.102, SE =
.010, z = −9.769, p < .001, 95% CI [−.123,
-.082], and suggested that higher scores in CRT were associated with lower
levels of endorsement of binding moral foundations. Then, we added
continuous WEIRDness score as a covariate to the model. The coefficient of
the intercept was significant (b = .096, SE = .035,
z = 2.730, p = .006, 95% CI [.027, .165]) and WEIRDness
significantly explained the variance in effects for different countries
(b = −.279, SE = .047, z = -5.889, p
< .001, 95% CI [−.371, −.186]). Accordingly, CRT had a stronger
negative effect on binding moral foundations in more WEIRD cultures (see
Figure 2). When a restricted maximum likelihood model was used, similar
findings were obtained except for that the moderation effect of WEIRDness
was marginally significant (p = .053; see the Appendix).
We also conducted separate analyses for non-WEIRD and WEIRD countries
(see Table 1 for the list of countries in each group). The meta-analytic
estimate of the overall effect size was statistically significant for
WEIRD countries(b = −.136, SE = .012, z =
−11.352, p < .001, 95% CI [−.159, −.112]), but not for
the non-WEIRD ones (b = .006, SE = .021, z =
.278, p = .781, 95% CI [−.036, .048]). So, the negative
relationship between CRT and binding foundations was unique to more WEIRD
contexts.
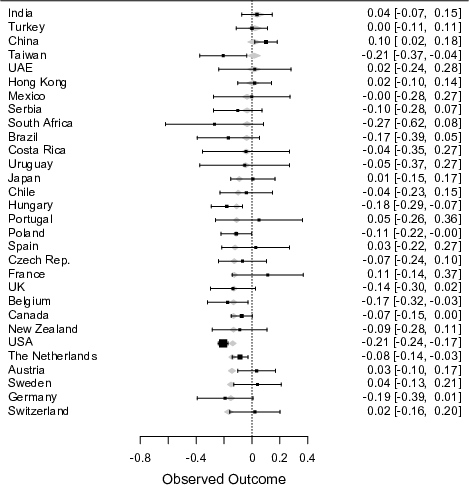
| Figure 2: The distribution of unstandardized regression
coefficients predicting binding moral foundations from CRT. Whiskers
represent 95% confidence intervals for the coefficients. Grey diamonds
represent the predictions from the level of WEIRDness. Countries are
ranked based on their mean WEIRDness scores with India being the least
WEIRD and Switzerland being the most WEIRD nation. |
Lastly, we added five components of WEIRDness as covariate to the model,
instead of mean WEIRDness score. Only education and democracy components had significant
effects (Table 3). Accordingly, the relationship between CRT and binding
foundations is more negative for countries with higher education level and
lower democracy.
| Table 4: Estimates for the effect of different components of WEIRDness on
binding foundations. |
| | b | SE | z | p | 95% CI |
| Intercept | 0.125 | 0.161 | 0.777 | 0.437 | -0.190 | : | 0.441 |
| Western | -0.080 | 0.047 | -1.706 | 0.088 | -0.172 | : | 0.012 |
| Educated | -0.769 | 0.233 | -3.302 | <.001 | -1.225 | : | -0.312 |
| Industrial | 0.037 | 0.071 | 0.518 | 0.605 | -0.102 | : | 0.176 |
| Rich | 0.016 | 0.058 | 0.278 | 0.781 | -0.097 | : | 0.130 |
| Democratic | 0.576 | 0.189 | 3.049 | 0.002 | 0.206 | : | 0.946 |
3.3 Exploratory Analyses on Individualizing Foundations
Although we did not have any a priori hypothesis regarding the relationship
between CRT and individualizing foundations or whether such relationship
would vary based on the level of WEIRDness, we conducted exploratory
analyses to provide a more complete picture of the data.
The combined effect without any covariate was not significant (b =
−.016, SE = .017, z = −.939, p = .348, 95%
CI [−.048, .017]). When continuous measure of WEIRDness was added to the
model as a covariate, the coefficient for the intercept was significant
(b = .117, SE = .042, z = −2.799, p =
.005, 95% CI [.035, .199]). WEIRDness as a covariate was also significant
(b = −.196, SE = .059, z = −3.328,
p < .001, 95% CI [−.312, −.081]). Accordingly, the
relationship between CRT and individualizing foundations was more negative
in more WEIRD cultures (see Figure 3). The same results were obtained when a
restricted maximum likelihood method was used (see the Appendix).
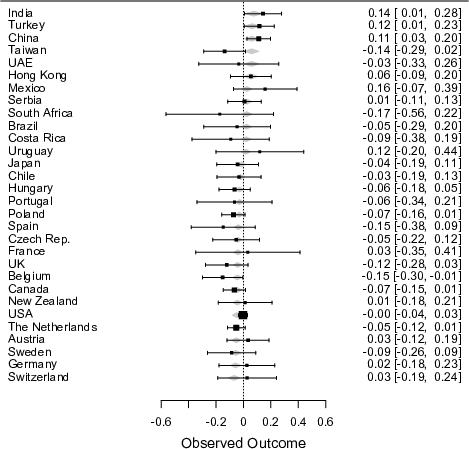
| Figure 3: The distribution of unstandardized regression
coefficients predicting individualizing moral foundations from CRT.
Whiskers represent 95% confidence intervals for the coefficients. Grey
diamonds represent the predictions from the level of WEIRDness.
Countries are ranked based on their mean WEIRDness scores with India
being the least WEIRD and Switzerland being the most WEIRD nation. |
When the groups of WEIRD and non-WEIRD countries were separately analyzed
(Table 1), CRT had a positive effect on individualizing foundations for
non-WEIRD countries (b = .052, SE = .022, z =
2.393, p = .017, 95% CI [.009, .095]), whereas it had a negative
effect for WEIRD countries (b = −.032, SE = .012,
z = −2.677, p = .007, 95% CI [−.055, −.009]). So,
high scores in CRT predicted higher endorsement of individualizing
foundations in non-WEIRD countries but lower endorsement in WEIRD
countries. When five components of WEIRDness, instead of the mean WEIRDness
score, were added as covariates, none of them was uniquely significant
(Table 5).
| Table 5: Estimates for the effect of different components of WEIRDness on
individualizing foundations. |
| | b | SE | z | p | 95% CI |
| Intercept | 0.122 | 0.184 | 0.664 | 0.507 | -0.238 | : | 0.482 |
| Western | -0.064 | 0.044 | -1.443 | 0.149 | -0.151 | : | 0.023 |
| Educated | 0.122 | 0.261 | 0.470 | 0.639 | -0.388 | : | 0.633 |
| Industrial | 0.058 | 0.068 | 0.854 | 0.393 | -0.075 | : | 0.191 |
| Rich | -0.066 | 0.056 | -1.175 | 0.240 | -0.176 | : | 0.044 |
| Democratic | -0.207 | 0.197 | -1.049 | 0.294 | -0.592 | : | 0.179 |
3.4 Exploratory Analyses on the Difference between Binding and
Individualizing Foundations
As CRT had an effect on individualizing foundations and that
effect varied based on the level of WEIRDness, similarly to the binding
foundations, we investigated whether CRT had an effect on the difference
between two types of foundations. We subtracted the mean score of
individualizing foundations from binding foundations and used those scores
as the outcome measures. These scores represented relative endorsement of
binding foundations as opposed to individualizing ones.
The combined effect was significant (b = −.089, SE =
.011, z = −8.370, p < .001, 95% CI [−.109,
−.068]). The negative relationship suggested that higher performance in CRT
was related to relatively more endorsement of individualizing foundations
as opposed to the binding ones. When WEIRDness was added to the model as a
covariate, the intercept, (b = −.030, SE = .031,
z = −0.946, p = .344, 95% CI [−.091, .032]), was
nonsignificant whereas the WEIRDness as moderator hadnegative effect
(b = −.087, SE = .044, z = −1.993,
p = .046, 95% CI [−.091, .032]; Figure 4). Accordingly, for more
WEIRD countries, the negative effect of CRT on
binding-minus-individualizing foundations was stronger. However, when
restricted maximum likelihood model was used, the moderation was not
significant (see the Appendix).
When we conducted separate analyses for the groups of non-WEIRD and WEIRD
countries (Table 1), CRT had a significantly negative association with the
difference score for both non-WEIRD (b = −.054, SE =
.019, z = −2.825, p = .005, 95% CI [−.092, −.017])and
WEIRD countries (b = −.104, SE = .013, z =
−8.171, p < .001, 95% CI [−.129, −.079]), but the
effect was relatively stronger in WEIRD countries. So, higher scores in CRT
was related to relatively higher endorsement of individualizing foundations
as opposed to the bindings one, and this effect was stronger in WEIRD
countries. Lastly, we added five components of WEIRDness, instead of mean
WEIRDness score, as covariates to the model. Education was negatively and
democracy was positively related (see Table 6). Accordingly, the negative
effect of CRT on binding-minus-individualizing foundations was relatively
stronger in countries with better education and lower democracy.
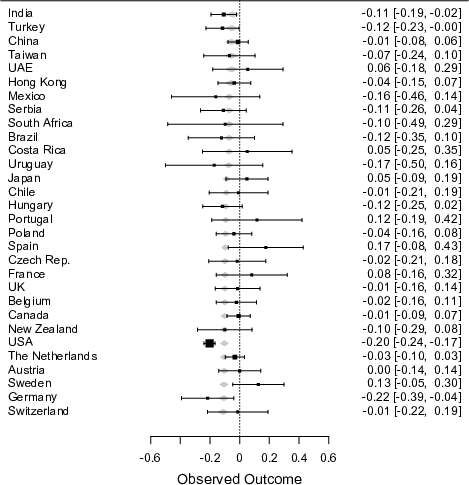
| Figure 4: The distribution of unstandardized regression
coefficients predicting the difference between binding and
individualizing foundations from CRT. Whiskers represent 95%
confidence intervals for the coefficients. Grey diamonds represent the
predictions from the level of WEIRDness. Countries are ranked based on
their mean WEIRDness scores with India being the least WEIRD and
Switzerland being the most WEIRD nation. |
4 Discussion
The current research provides the first empirical test of cross-cultural
generalizability of the ACS-ideology link in 30 politically diverse
societies. The results show that although ACS has a significant negative
relationship with social conservatism (measured by both the level of
endorsement of binding moral foundations and the difference between
binding and individualizing foundations) in the overall sample, the
magnitude of this relationship is weaker in non-WEIRD cultures as compared
to the WEIRD ones. There was also a negative correlation between the
commonly used single-item political orientation question and ACS, but
WEIRDness did not moderate this effect and a different meta-analysis
technique did not yield any effect. These findings are consistent with
past findings, suggesting that ACS is associated with social attitudes in
general (e.g., Pennycook, Fugelsang & Koehler, 2015), and social
conservatism in particular (e.g., Yilmaz & Saribay, 2018a). The finding
that the degree of WEIRDness of a culture influences the magnitude of the
relationship has also the potential to explain a number of mixed findings
previously observed in the literature.
| Table 6: Estimates for the effect of different components of WEIRDness on
difference between binding and individualizing foundations. |
| | b | SE | z | p | 95% CI |
| Intercept | -0.126 | 0.144 | -0.871 | 0.384 | -0.408 | : | 0.157 |
| Western | -0.033 | 0.044 | -0.739 | 0.460 | -0.120 | : | 0.054 |
| Educated | -0.589 | 0.214 | -2.749 | 0.006 | -1.008 | : | -0.169 |
| Industrial | -0.015 | 0.073 | -0.209 | 0.835 | -0.158 | : | 0.127 |
| Rich | 0.049 | 0.056 | 0.879 | 0.379 | -0.061 | : | 0.160 |
| Democratic | 0.671 | 0.184 | 3.652 | <.001 | 0.311 | : | 1.031 |
First of all, the majority of the findings in the literature come from
WEIRD cultures. Similarly, a meta-analysis of Jost et al. (2018) is
substantially limited to studies with WEIRD cultures. An exception is
data collected from Turkey (Bahçekapili & Yilmaz, 2017; Yilmaz &
Saribay, 2016, 2018a). Although a significant negative relationship
between ACS and social conservatism was generally found (Yilmaz &
Saribay, 2016, 2018a), there is no consistent pattern of relationship
across samples in Turkey (Yilmaz & Saribay, 2017b), a non-WEIRD
culture (Klein et al., 2018). The effect sizes of the studies conducted
in Turkey are generally smaller than similar research conducted in
WEIRD cultures (Yilmaz & Saribay, 2017c). Similarly, whereas both
Pennycook et al. (2014) and Landy (2016) found a significant negative
relationship between CRT and binding moral foundations (patriotism,
respect for traditions, and bodily purity) in WEIRD cultures (U.S.),
Yilmaz and Saribay (2017b) found no significant relationship in a
non-WEIRD culture (Turkey). Therefore, the findings of the current
research explain the mixed findings of some previous studies by
proposing a boundary condition for the cross-cultural generalizability
of the link between ideology and ACS.
Findings related to single item political orientation were mixed. Although
a fixed-effects method yielded a negative effect of ACS on ideology, the
same result was not obtained with a restricted maximum likelihood method.
This suggests that the results regarding self-reported ideology were
somewhat less reliable as compared to social conservatism. This was
generally consistent with the literature since although it was previously
used as a reliable measure in the literature (Jost, 2006), Iyer et al.’s
(2012) findings highlight its limitation. The argument is that although
libertarians are different from conservatives in terms of social attitudes
(i.e., social conservatism), they place themselves on the conservative
side of this single item political orientation question. Assuming there
might be different groups with different labels in other cultures having
similar social attitudes of the libertarians, these results might imply
that this single item political orientation question is not a reliable
measurement tool that can be used in a cross-cultural examination.
So why is there a difference between WEIRD and non-WEIRD cultures in the
relationship between ACS and social conservatism? Although this study
remains silent on this issue, we conjecture that ACS is more effective in
influencing political attitudes in cultures where the left-right division
is very clearly differentiated. Although there is no direct evidence for
this argument yet, there is some indirect support. For example, if we
compare Turkish (a non-WEIRD culture) and US (a WEIRD culture) political
systems, we can see that Turkish political atmosphere is not clearly
divided by left-right or liberal-conservative distinction as in the
American counterpart (Mardin, 1973; Öniş, 2007; Özbudun, 2006). Yılmaz,
Saribay, Bahçekapılı and Harma (2016b) also showed in Turkey that the
supporters of CHP (Republican People’s Party) — the major social
democratic party — did not distinguish from the supporters of MHP
(Nationalist Movement Party) and AKP (Justice and
Development Party) — the two major conservative parties — on the
importance they give to the binding foundations (i.e., social
conservatism). Social conservatism is very high in Turkey, and this might
be the case for other non-WEIRD cultures as well. Therefore, the fact that
the variance related to social conservatism is much narrower in non-WEIRD
cultures might explain why the relationship between social conservatism and
CRT is so weak here.
4.1 Limitations and Future Questions
First, an important potential limitation is that some results were weak,
with their clarity somewhat dependent on the method used (fixed effects
meta-analysis vs. random effects, maximum likelihood vs. restricted
maximum likelihood), especially the results concerned with ideology, where
CRT had no effect on ideology with maximum liklihood, and the moderating
effect of WEIRDness on the relationship between CRT and binding foundations
was only marginally significant. However, we argue that the pattern in
results suggest that culture matters in the relationship between ACS and
political orientations, although the direction and magnitude of this
relationship might not be very clear.
Another limitation of this research is that it uses only three numerical CRT
questions to measure ACS. Although there are some recent findings
indicating that CRT corresponds to a stable personality trait (Meyer et
al., 2018; Stagnaro et al., 2018), there are also some others claiming that
it sometimes does not measure relevant aspects of ACS (e.g., Baron, Scott,
Fincher & Metz, 2015). Although the results generally remained constant
when other ACS measures were used (e.g., Pennycook et al., 2014), Yilmaz
and Saribay (2017c) found that the three different ACS measures (CRT-2,
Base rate Conflict Problems, and Actively Open Minded-Thinking) were
significantly (and negatively) related to social conservatism, and that CRT
was not individually related to any of the ideology measures (including
social conservatism). Therefore, future studies should use other ACS
measures in addition to CRT in order to show the cross-cultural validity of
the findings here.
Assuming that these correlations might give an idea about the potential
cause-effect relation between ACS and social conservatism (i.e., causality
flows from a more basic, cognitive variable to sociopolitical attitudes,
which is partially supported by Yilmaz & Saribay, 2017a), the same
boundary condition has also the potential to explain the mixed findings
regarding experimental work in the literature.2 One of the first empirical demonstrations of the causal effect
of intuition on conservatism was conducted by Eidelman et al. (2012) using
WEIRD (i.e., US) samples but were not replicated in later high-powered
studies using non-WEIRD samples (Yilmaz & Saribay, 2016,
2018b). Therefore, similar attempts to reconcile the mixed findings might
consider experimentally controlling the degree of WEIRDness of culture in
future studies.
The most important contribution of this study is to show the moderating
role of culture by moving beyond WEIRD samples. However, although this
study was based on 30 politically diverse societies that are not frequently
used in psychology research, it still does not say anything about
less-represented groups such as small-scale hunter-gatherers or older
adults. More importantly, none of the samples were selected based on a
probabilistic random sampling procedure, therefore any of them do not
represent the characteristics of each country as a whole. Another potential
limitation, and an alternative explanation for the lower correlations in
non-WEIRD cultures is the possibility of noisy data (i.e., translation
issues) and lower levels of survey expertise (i.e., less familiarity with
the survey response scales). Therefore, in order to confidently conclude
that there are real cultural differences, future studies should account for
these two issues. Pennycook and Rand (2019) also showed that political
participation is positively correlated with CRT scores, and the association
between CRT and binding foundations might be driven by some politically
disengaged moderates in either WEIRD or non-WEIRD cultures in the current
study. However, this goes beyond the scope of the present research as the
available set of measures did not include a measure of political
participation.
4.2 Conclusion
The current study shows for the first time that the relationship between
ACS and social conservatism is stable for only WEIRD cultures.
Therefore, if an independent observer wants to predict one’s degree of
social conservatism, she must look at both the level of ACS and where
she lives, since the findings of the current study illustrates that
there is an important cross-cultural variability on this relationship.
Although ACS explains unique variance in social conservatism, the
effect sizes are small even in WEIRD cultures, which indicate that
cultural factors may be more important than differences in cognitive
style. Overall, this study emphasizes the limitations of studying only
WEIRD cultures for making inferences about human universals (especially
on the moral domain).
References
Bahçekapili, H. G., & Yilmaz, O. (2017). The relation between different
types of religiosity and analytic cognitive style. Personality
and Individual Differences, 117, 267–272.
Baron, J., Scott, S., Fincher, K., & Metz, S. E. (2015). Why does the
Cognitive Reflection Test (sometimes) predict utilitarian moral judgment
(and other things)?. Journal of Applied Research in Memory and
Cognition, 4(3), 265–284.
Berniūnas, R., Dranseika, V., & Sousa, P. (2016). Are there different
moral domains? Evidence from Mongolia. Asian Journal of Social
Psychology, 19(3), 275–282.
Brandt, M. J., Evans, A. M., & Crawford, J. T. (2015). The unthinking
or confident extremist? Political extremists are more likely than
moderates to reject experimenter generated anchors.
Psychological Science, 26(2), 189–202.
Buchtel, C., & Norenzayan, A. (2009). Thinking across cultures:
Implications for dual processes. In J. St. B. T. Evans & K. Frankish
(Eds.), In two minds: Dual processes and beyond (pp. 217–238).
Oxford, England: Oxford University Press.
Davies, C. L., Sibley, C. G., & Liu, J. H. (2014). Confirmatory factor
analysis of the Moral Foundations Questionnaire. Social
Psychology, 45, 431–436.
Deppe, K. D., Gonzalez, F. J., Neiman, J. L., Jacobs, C., Pahlke, J.,
Smith, K. B., & Hibbing, J. R. (2015). Reflective liberals and
intuitive conservatives: A look at the Cognitive Reflection Test and
ideology. Judgment and Decision Making, 10(4),
314–331.
Eidelman, S., Crandall, C. S., Goodman, J. A., & Blanchar, J. C.
(2012). Low-effort thought promotes political
conservatism. Personality and Social Psychology
Bulletin, 38(6), 808–820.
Federico, C. M., Weber, C. R., Ergun, D., & Hunt, C. (2013). Mapping the
connections between politics and morality: The multiple sociopolitical
orientations involved in moral intuition. Political Psychology,
34(4), 589–610. http://dx.doi.org/10.1111/pops.12006.
Finucane, M. L., & Gullion, C. M. (2010). Developing a tool for measuring
the decision-making competence of older adults. Psychology and
Aging, 25(2), 271–288.
Frederick, S. (2005). Cognitive reflection and decision making.
The Journal of Economic Perspectives, 19(4),
25–42.
Gervais, W. M., van Elk, M., Xygalatas, D., McKay, R. T., Aveyard, M.,
Buchtel, E. E., ... & Svedholm-Häkkinen, A. M. (2018). Analytic atheism: A
cross-culturally weak and fickle phenomenon?. Judgment and Decision
Making, 13(3), 268–274.
Graham, J., Nosek, B. A., Haidt, J., Iyer, R., Koleva, S., & Ditto, P.
H. (2011). Mapping the moral domain. Journal of Personality and
Social Psychology, 101, 366–385. http://dx.doi.org/10.1037/a0021847.
Iyer, R., Koleva, S., Graham, J., Ditto, P., & Haidt, J. (2012).
Understanding libertarian morality: The psychological dispositions of
self-identified libertarians. PLOSONE, 7(8), e42366.
JASP Team (2011). JASP (Version 0.9) [Computer software].
Jost, J. T., Glaser, J., Kruglanski, A. W., & Sulloway, F. J. (2003).
Political conservatism as motivated social
cognition. Psychological Bulletin, 129(3), 339–375.
Jost, J. T. (2006). The end of the end of ideology. American
Psychologist, 61(7), 651–670.
Jost, J. T. (2012). Left and right, right and wrong. Science,
337(6094), 525–526. http://dx.doi.org/10.1126/science.1222565.
Jost, J. T., Sterling, J., & Stern, C. (2018). Getting closure on
conservatism, or the politics of epistemic and existential motivation. In
C. Kopetz, & A. Fishbach (Eds.), The motivation-cognition
interface; From the lab to the real world: A Festschrift in honor of Arie
W. Kruglanski. (pp. 56–87). New York, NY: Routledge/Taylor & Francis.
Henrich, J., Heine, S. J., & Norenzayan, A. (2010). The weirdest people in
the world?. Behavioral and Brain Sciences, 33(2–3),
61–83.
Kahan, D. M. (2013). Ideology, motivated reasoning, and cognitive
reflection. Judgment and Decision Making, 8(4),
407–424.
Klein, R. A., Vianello, M., Hasselman, F., Adams, B. G., Adams, R. B., Jr.,
Alper, S., … Nosek, B. A. (2018). Many Labs 2: Investigating variation in
replicability across sample and setting.
https://doi.org/10.31234/osf.io/9654g.
Kugler, M., Jost, J. T., & Noorbaloochi, S. (2014). Another look at
moral foundations theory:
Do authoritarianism and social dominance orientation explain
liberal-conservative differences in “moral” intuitions?. Social
Justice Research, 27(4), 413–431.
Landy, J. F. (2016). Representations of moral violations: Category
members and associated features. Judgment and Decision
Making, 11(5), 496–508.
Mardin, Ş. (1973). Center-periphery relations: A key to Turkish
politics?. Daedalus, 169–190.
Métayer, S., & Pahlavan, F. (2014). Validation de l’adaptation
française du questionnaire des principes moraux
fondateurs. Revue Internationale de Psychologie
Sociale, 27(2), 79–107.
Meyer, A., Zhou, E., & Frederick, S. (2018). The non-effects of
repeated exposure to the Cognitive Reflection Test. Judgment
and Decision Making, 13(3), 246–259.
Milojev, P., Osborne, D., Greaves, L. M., Bulbulia, J., Wilson, M. S.,
Davies, C. L., ... & Sibley, C. G. (2014). Right-wing authoritarianism
and social dominance orientation predict different moral
signatures. Social Justice Research, 27(2), 149–174.
http://dx.doi.org/ 10.1007/s11211-014-0213-7.
Muthukrishna, M., Bell, A. V., Henrich, J., Curtin, C. M., Gedranovich,
A., McInerney, J., & Thue, B. (2018). Beyond WEIRD psychology:
measuring and mapping scales of cultural and psychological
distance. https://dx.doi.org/10.2139/ssrn.3259613.
Nilsson, A., & Erlandsson, A. (2015). The Moral Foundations taxonomy:
Structural validity and relation to political ideology in
Sweden. Personality and Individual Differences, 76,
28–32. http://dx.doi.org/ 10.1016/j.paid.2014.11.049.
Öniş, Z. (2007). Conservative globalists versus defensive nationalists:
political parties and paradoxes of Europeanization in
Turkey. Journal of Southern Europe and the Balkans, 9(3),
247–261.
Özbudun, E. (2006). Changes and continuities in the Turkish party
system. Representation, 42(2), 129–137.
Piazza, J., & Sousa, P. (2014). Religiosity, political orientation, and
consequentialist moral thinking. Social Psychological and
Personality Science, 5, 334–342.
Pennycook, G., Cheyne, J. A., Seli, P., Koehler, D. J., & Fugelsang, J.
A. (2012). Analytic cognitive style predicts religious and
paranormal belief. Cognition, 123(3), 335–346.
Pennycook, G., Cheyne, J. A., Barr, N., Koehler, D. J., & Fugelsang, J.
A. (2014). The role of analytic thinking in moral judgements and
values. Thinking & Reasoning, 20(2), 188–214.
Pennycook, G., Fugelsang, J. A., & Koehler, D. J. (2015). Everyday
consequences of analytic thinking. Current Directions in
Psychological Science, 24(6), 425–432.
Pennycook, G., & Rand, D. G. (2019). Cognitive reflection and the 2016 US
Presidential election. Personality and Social Psychology Bulletin,
45(2), 224–239.
Saribay, S. A., & Yilmaz, O. (2017). Analytic cognitive style and
cognitive ability differentially predict religiosity and social
conservatism. Personality and Individual Differences,
114, 24–29.
Sinn, J. S., & Hayes, M. W. (2016). Replacing the Moral Foundations: An
Evolutionary-Coalitional Theory of Liberal-Conservative
Differences. Political
Psychology. http://dx.doi.org/10.1111/pops.12361.
Stagnaro, M. N., Pennycook, G., & Rand, D. G. (2018). Performance on
the Cognitive
Reflection Test is stable across time. Judgment and Decision
making, 13(3), 260–267.
Sterling, J., Jost, J. T., & Pennycook, G. (2016). Are neoliberals more
susceptible to bullshit?. Judgment and Decision Making,
11(4), 352–360.
Talhelm, T., Haidt, J., Oishi, S., Zhang, X., Miao, F. F., & Chen, S.
(2015). Liberals think more analytically (more “WEIRD”) than
conservatives. Personality and Social Psychology Bulletin,
41(2), 250–267.
Talhelm, T. (2018). Hong Kong liberals are WEIRD: Analytic thought
increases support for liberal policies. Personality and Social
Psychology Bulletin, 44(5), 717–728.
Van Berkel, L., Crandall, C. S., Eidelman, S., & Blanchar, J. C.
(2015). Hierarchy, dominance, and deliberation: Egalitarian values
require mental effort. Personality and Social Psychology
Bulletin, 41(9), 1207–1222.
Viechtbauer, W. (2010). Conducting meta-analyses in R with the metafor
package. Journal of Statistical Software, 36(3), 1–48.
http://www.jstatsoft.org/v36/i03/
Yilmaz, O., & Saribay, S. A. (2016). An attempt to clarify the link
between cognitive style and political ideology: A non-western
replication and extension. Judgment and Decision
Making, 11(3), 287–300.
Yilmaz, O., Harma, M., Bahçekapili, H. G., & Cesur, S. (2016a).
Validation of the moral foundations questionnaire in Turkey and its
relation to cultural schemas of individualism and
collectivism. Personality and Individual Differences, 99,
149–154.
Yılmaz, O., Saribay, S. A., Bahçekapılı, H. G., & Harma, M. (2016b).
Political orientations, ideological self-categorizations, party
preferences, and moral foundations of young Turkish voters. Turkish
Studies, 17(4), 544–566.
Yilmaz, O., & Saribay, S. A. (2017a). Analytic thought training
promotes liberalism on contextualized (but not stable) political
opinions. Social Psychological and Personality Science, 8(7),
789–795.
Yilmaz, O., & Saribay, S. A. (2017b). Activating analytic thinking
enhances the value given to individualizing moral
foundations. Cognition, 165, 88–96.
Yilmaz, O., & Saribay, S. A. (2017c). The relationship between cognitive
style and political orientation depends on the measures
used. Judgment and Decision Making, 12(2),
140–147.
Yilmaz, O., & Saribay, S. A. (2018a). Lower levels of resistance to change
(but not opposition to equality) is related to analytic cognitive style.
Social Psychology, 49, 65–75.
Yilmaz, O., & Saribay, S. A. (2018b). A preregistered replication attempt
of Eidelman, Crandall, Goodman, and Blanchar (2012). Unpublished
Raw Data. https://osf.io/uqp4g/.
Zhang, Y., & Li, S. (2015). Two measures for cross-cultural research on
morality: Comparison and revision. Psychological
Reports, 117(1), 144–166.
Appendix
| Table 7: Correct responses to item #2 of Cognitive Reflection Test. For
the remaining countries, the correct response was 2.25. |
| Country | Correct Response |
| Chile | 270 |
| China | 14 |
| Costa Rica | 2250 |
| Czech Rep. | 22.5 |
| France | 2 |
| Hong Kong (China) | 22.5 |
| Japan | 225 |
| Mexico | 22.5 |
| Serbia | 250 |
| Switzerland | 2 |
| Taiwan (China) | 22.5 |
| Uruguay | 22.5 |
| Table 8: Correlations of main variables with CRT for each country. |
Country (N) | | Ideology | Binding F. | Individualizing F. |
Austria (123) | | 0.091 | 0.046 | 0.041 |
Belgium (110) | | -0.165 | -0.224 | -0.193 |
Brazil (103) | | 0.047 | -0.148 | -0.038 |
Canada (601) | | -0.016 | -0.079 | -0.066 |
Chile (155) | | -0.059 | -0.036 | -0.034 |
China (392) | | 0.020 | 0.126 | 0.129 |
Costa Rica (103) | | 0.013 | -0.027 | -0.067 |
Czech Rep (141) | | -0.039 | -0.068 | -0.053 |
France (44) | | 0.010 | 0.134 | 0.025 |
Germany (91) | | -0.137 | -0.203 | 0.026 |
Hong Kong (173) | | -0.045 | 0.023 | 0.055 |
Hungary (182) | | -0.066 | -0.236 | -0.085 |
India (360) | | 0.004 | 0.035 | 0.112 |
Japan (114) | | 0.215 | 0.009 | -0.095 |
Mexico (144) | | 0.016 | -0.001 | 0.118 |
New Zeal. (102) | | -0.171 | -0.089 | 0.013 |
Poland (231) | | 0.095 | -0.135 | -0.114 |
Portugal (36) | | 0.221 | 0.056 | -0.081 |
Serbia (107) | | -0.051 | -0.111 | 0.012 |
South Africa (74) | | -0.273 | -0.182 | -0.105 |
Spain (54) | | -0.404 | -0.031 | -0.171 |
Sweden (113) | | 0.248 | 0.045 | -0.092 |
Switzerland (112) | | -0.046 | 0.022 | 0.024 |
Taiwan (137) | | -0.129 | -0.209 | -0.154 |
Netherlands (486) | | -0.046 | -0.135 | -0.073 |
Turkey (239) | | -0.063 | 0.000 | 0.136 |
UAE (92) | | 0.015 | 0.017 | -0.024 |
UK (142) | | 0.142 | -0.141 | -0.132 |
Uruguay (87) | | -0.131 | -0.036 | 0.084 |
USA (2382) | | -0.083 | -0.229 | -0.004 |
| Table 9: Descriptive statistics for main variables (SD in parentheses). |
| Country (N) | CRT | Ideology | Binding F. | Individualizing F. |
| Austria (123) | 1.256 (0.902) | 3.340 (0.841) | 3.585 (0.674) | 5.031 (0.744) |
| Belgium (110) | 0.722 (0.874) | 3.950 (1.190) | 3.923 (0.684) | 4.863 (0.687) |
| Brazil (103) | 0.592 (0.744) | 3.400 (1.423) | 3.630 (0.840) | 4.914 (0.883) |
| Canada (601) | 0.612 (0.800) | 3.940 (1.005) | 3.982 (0.751) | 4.817 (0.807) |
| Chile (155) | 0.307 (0.586) | 4.190 (1.346) | 4.347 (0.676) | 5.330 (0.558) |
| China (392) | 1.432 (0.934) | 3.900 (1.029) | 3.950 (0.769) | 4.138 (0.844) |
| Costa Rica (103) | 0.242 (0.455) | 3.520 (1.173) | 4.220 (0.693) | 5.210 (0.631) |
| Czech Rep. (141) | 0.444 (0.633) | 4.470 (1.105) | 3.959 (0.640) | 4.748 (0.640) |
| France (44) | 1.047 (1.022) | 4.180 (1.483) | 3.496 (0.872) | 4.019 (1.291) |
| Germany (91) | 0.872 (0.732) | 3.130 (0.810) | 3.584 (0.680) | 4.989 (0.675) |
| Hong Kong (China) (173) | 1.195 (0.940) | 3.410 (1.880) | 3.907 (0.756) | 4.552 (0.922) |
| Hungary (182) | 0.821 (0.887) | 3.520 (1.331) | 3.826 (0.702) | 5.064 (0.667) |
| India (360) | 0.894 (0.868) | 4.480 (1.191) | 3.833 (0.893) | 4.019 (1.096) |
| Japan (114) | 0.750 (0.856) | 4.040 (0.976) | 3.912 (0.685) | 4.616 (0.677) |
| Mexico (144) | 0.182 (0.442) | 3.420 (1.122) | 4.116 (0.717) | 5.207 (0.588) |
| New Zealand (102) | 0.571 (0.786) | 3.520 (1.326) | 3.888 (0.789) | 4.861 (0.771) |
| Poland (231) | 0.562 (0.750) | 3.480 (1.364) | 4.069 (0.632) | 4.911 (0.485) |
| Portugal (36) | 0.571 (0.815) | 3.580 (1.200) | 3.973 (0.754) | 5.032 (0.649) |
| Serbia (107) | 0.717 (0.859) | 3.240 (1.203) | 3.910 (0.784) | 5.169 (0.539) |
| South Africa (74) | 0.265 (0.507) | 3.600 (1.650) | 4.010 (0.736) | 4.956 (0.819) |
| Spain (54) | 1.000 (0.855) | 4.750 (1.186) | 4.278 (0.757) | 4.755 (0.731) |
| Sweden (113) | 0.897 (0.900) | 3.040 (1.768) | 3.377 (0.790) | 4.778 (0.824) |
| Switzerland (112) | 1.125 (0.840) | 3.130 (1.411) | 3.502 (0.811) | 4.361 (0.944) |
| Taiwan (China) (137) | 0.931 (0.809) | 3.860 (1.117) | 4.080 (0.796) | 4.700 (0.709) |
| The Netherlands (486) | 0.935 (0.961) | 3.980 (1.279) | 3.755 (0.599) | 4.746 (0.680) |
| Turkey (239) | 0.957 (0.945) | 2.870 (1.350) | 3.704 (0.812) | 4.656 (0.829) |
| UAE (92) | 0.319 (0.575) | 3.650 (1.188) | 4.127 (0.711) | 4.817 (0.809) |
| UK (142) | 0.507 (0.707) | 3.500 (1.119) | 3.925 (0.686) | 5.038 (0.653) |
| Uruguay (87) | 0.241 (0.486) | 2.820 (1.651) | 4.058 (0.697) | 5.082 (0.694) |
| USA (2382) | 0.754 (0.892) | 3.650 (1.547) | 3.977 (0.807) | 4.928 (0.747) |
| Table 10: Bivariate correlations between CRT, ideology, binding foundations, and
individualizing foundations. |
| | | CRT | Ideology | Binding F. |
| Ideology | Pearson’s r | -0.035 | |
| | p-value | 0.003 | | |
| | Upper 95% CI | -0.012 | | |
| | Lower 95% CI | -0.059 | | |
| Binding | Pearson’s r | -0.136 | 0.145 | |
| | p-value | <.001 | <.001 | |
| | Upper 95% CI | -0.113 | 0.168 | |
| | Lower 95% CI | -0.159 | 0.122 | |
| Individualizing | Pearson’s r | -0.074 | -0.134 | 0.482 |
| | p-value | <.001 | <.001 | <.001 |
| | Upper 95% CI | -0.050 | -0.111 | 0.499 |
| | Lower 95% CI | -0.097 | -0.157 | 0.464 |
| Table 11: Bivariate correlations for countries categorized as WEIRD
cultures. |
| | | CRT | Ideology | Binding F. |
| Ideology | Pearson’s r | -0.035 | |
| | p-value | 0.003 | | |
| | Upper 95% CI | -0.012 | | |
| | Lower 95% CI | -0.059 | | |
| Binding | Pearson’s r | -0.136 | 0.145 | |
| | p-value | <.001 | <.001 | |
| | Upper 95% CI | -0.113 | 0.168 | |
| | Lower 95% CI | -0.159 | 0.122 | |
| Individualizing | Pearson’s r | -0.074 | -0.134 | 0.482 |
| | p-value | <.001 | <.001 | <.001 |
| | Upper 95% CI | -0.050 | -0.111 | 0.499 |
| | Lower 95% CI | -0.097 | -0.157 | 0.464 |
| Table 12: Bivariate Correlations for countries categorized as non-WEIRD
cultures. |
| | | CRT | Ideology | Binding F. |
| Ideology | Pearson’s r | -0.062 | |
| | p-value | <.001 | | |
| | Upper 95% CI | -0.034 | | |
| | Lower 95% CI | -0.090 | | |
| Binding | Pearson’s r | -0.186 | 0.161 | |
| | p-value | <.001 | <.001 | |
| | Upper 95% CI | -0.159 | 0.188 | |
| | Lower 95% CI | -0.213 | 0.134 | |
| Individualizing | Pearson’s r | -0.050 | -0.128 | 0.453 |
| | p-value | <.001 | <.001 | <.001 |
| | Upper 95% CI | -0.023 | -0.101 | 0.474 |
| | Lower 95% CI | -0.078 | -0.156 | 0.431 |
Results of Meta-Analyses of Foundations with Random Effects
The Effect on Binding Foundations
The combined meta−analytic effect was significant (b
= −.061, SE = .020, z = −3.095, p = .002, 95%
CI [−.101, −.023]). When continuous WEIRDness score was added to the model
as a covariate, intercept was nonsignificant (b = .038,
SE = .051, z = .736, p = .462, 95% CI [−.063,
.138]) and WEIRDness as a covariate was significant, but barely (b
= −.156, SE = .074, z = −2.103, p = .036, 95%
CI [−.301, .012]).
The Effect on Individualizing Foundations
The combined meta-analytic effect was not statistically
significant (b = −.016, SE = .016, z = −.957,
p = .339, 95% CI [−.048, .016]). When continuous WEIRDness score
was added to the model as a covariate, both intercept (b = .117,
SE = .041, z = 2.882, p = .004, 95% CI [.038,
.197]) and WEIRDness as a covariate were significant (b = −.194,
SE = .057, z = −3.413, p < .001, 95%
CI [−.305, −.082]).
The difference between binding and individualizing foundations as a
covariate was not close to significant (as in other analyses).
Results of Meta-Analyses with Restricted Maximum Likelihood Method
The Effect on Ideology
The combined meta-analytic effect was not statistically significant
(b = −.035, SE = .029, z = −1.234, p =
.217, 95% CI [−.091, .021]). When continuous WEIRDness score was added to
the model as a covariate, neither the intercept (b = −.041,
SE = .083, z = −.488, p = .625, 95% CI [−.204,
.123]) nor WEIRDness as a covariate had a significant effect (b =
.009, SE = .122, z = .071, p = .943, 95% CI
[−.230, .247]; see Figure 1).
The Effect on Binding Foundations
The combined meta−analytic effect was significant (b
= −.061, SE = .020, z = −3.041, p = .002, 95%
CI [−.101, −.022]). When continuous WEIRDness score was added to the model
as a covariate, intercepts was nonsignificant (b = .034,
SE = .053, z = .639, p = .523, 95% CI [−.703,
.138]) and WEIRDness as a covariate was marginally significant (b
= −.149, SE = .077, z = −1.936, p = .053, 95%
CI [−.300, .002]; see Figure 2).
The Effect on Individualizing Foundations
The combined meta-analytic effect was not statistically
significant (b = −.016, SE = .017, z = −.939,
p = .348, 95% CI [−.048, .017]). When continuous WEIRDness score
was added to the model as a covariate, both intercept (b = .117,
SE = .042, z = 2.799, p = .005, 95% CI [.035,
.199]) and WEIRDness as a covariate were significant (b = −.196,
SE = .059, z = −3.328, p < .001, 95%
CI [−.312, −.081]; see Figure 3).
The Effect on the Difference between Binding and Individualizing
Foundations
The combined meta-analytic effect was statistically
significant (b = −.050, SE = .0182, z = −2.818,
p = .005, 95% CI [−.086, −.015]). When continuous WEIRDness
score was added to the model as a covariate, neither intercept (b
= −.074, SE = .051, z = −1.435, p = .151, 95%
CI [−.174, .027]) nor WEIRDness as a covariate was significant (b
= .037, SE = .075, z = 0.494, p = .621, 95% CI
[−.110, .184]; see Figure 4).
This document was translated from LATEX by
HEVEA.