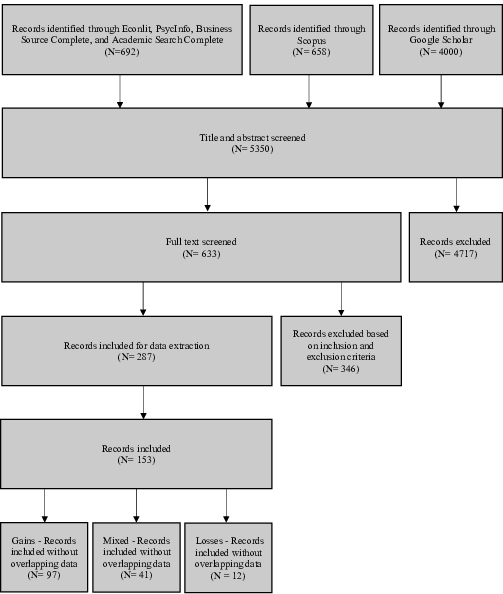
| Figure 1: Overview of the literature search. |
Judgment and Decision Making, Vol. 14, No. 3, May 2019, pp. 234-279
Cognitive ability and risk aversion: A systematic review and meta analysisLau Lilleholt* |
Are highly intelligent people less risk averse? Over the last two decades scholars have argued the existence of a negative relationship between cognitive ability and risk aversion. Although numerous studies support this, the link between cognitive ability and risk aversion has not been found consistently. To shed new light on this topic, a systematic review and meta-analysis was conducted. A total of 97 studies were identified and included for meta-analysis in the domain of gains (N=90,723), 41 in the mixed domain (N=50,936), and 12 in the domain of losses (N=4,544). Results indicate that there exists a weak, but significant negative relationship between cognitive ability and risk aversion in the domain of gains. However, no relationship was observed in the mixed domain or in the domain of losses. Several meta-regressions were performed to investigate the influence of moderator variables. None of the moderator variables were found to consistently influence the relationship between cognitive ability and risk aversion across the domain of gains, mixed and losses. Moreover, no significant difference was observed between males and females across all three domains. In conclusion, this systematic review and meta-analysis provides new evidence that the relationship between cognitive ability and risk aversion is domain specific and not as strong as suggested by some previous studies.
Keywords: risk aversion, cognitive ability, risk preferences,
intelligence, meta-analysis
In economic theory, risk aversion is assumed to be a key determinant of human decision making. Naturally, the study of risk aversion has gained a lot of attention, attracting researchers from all over the world. For the past two decades, a number of scholars have argued that highly intelligent individuals tend to be less risk averse (Benjamin, Brown & Shapiro, 2013; Dohmen, Falk, Huffman & Sunde, 2010, 2018; Frederick, 2005), and thus more likely to optimize their choices in line with the normative benchmark of Expected Utility Theory (Rabin, 2000; Rabin & Thaler, 2001). Although a substantial amount of empirical evidence supports this conclusion (Dohmen et al., 2018), several studies do not find cognitive ability to be consistently related to risk aversion. For instance, some studies have found cognitive ability to be negatively related to risk aversion in the domain of gains but positively related in the mixed domain (Burks, Carpenter, Goette & Rustichini, 2009; Chapman, Snowberg, Wang, & Camerer, 2018). Similarly, Andersson, Holm, Tyran and Wengström (2016), concluded that the relationship might be spurious and dependent on the choice architecture of the decision task used to elicit risk preferences. Specifically, they reported a negative relationship when the percentage of alternative responses indicating risk aversion was set to 80% and a positive relationship when this was set to 50%. A potential explanation for this result is that people with low cognitive ability tend to make more random errors, leading risk aversion to be overestimated for this group when the percentage of alternatives permitting a choice indicating risk aversion is high, while underestimated when the opposite is the case (Andersson et al., 2016). Finally, several studies suggest that the negative relationship between cognitive ability and risk aversion exists only when the decision task used to elicit risk aversion is unincentivized and purely hypothetical (Sousa & Rangel, 2014; Taylor, 2013, 2016). In summary, it is unclear whether a negative relationship actually exists, and if so, to what extent. The purpose of this study is to investigate the nature of the relationship between cognitive ability and risk aversion, through a systematic literature review and meta-analysis.
The remainder of this article is organized as follows. First, a brief definition of cognitive ability and risk aversion is provided. Next, several theoretical explanations for why cognitive ability and risk aversion might be negatively related are presented, followed by an outline of the present investigation. Then the literature review and meta-analysis are discussed.
When conducting a systematic literature review and meta-analysis it is important to define the key variables of interest (Borenstein, Hedges, Higgins & Rothstein, 2009; Cooper, 2010).
Cognitive ability is one of the best researched, yet most controversial constructs within the field of psychology (Eysenck, 1998; Freund & Kasten, 2012; Sternberg, 1985). In general terms, cognitive ability is considered an extensive category, encompassing a wide range of abilities such as reasoning, problem solving and abstract thinking (Gottfredson, 1997). Throughout the history of the field, several influential scholars have attempted to converge on a single definition of the construct (Carroll, 1997; Freund & Kasten, 2012). Although no uniform definition of cognitive ability exists, Murphy and Davidshofer (1998) provides a definition that has proven useful in applied psychology (e.g., Seijts & Crim, 2009; Yeo & Neal, 2004). In line with their definition, cognitive ability will for the purposes of this study be defined as individual differences in the capacity to successfully perform tasks that require the manipulation, retrieval, evaluation or processing of mental information. This definition is closely related to what psychologists refer to as g or general cognitive ability, a factor considered to be the core of, and primary source of variance common to, cognitive abilities and cognitive ability tests (Spearman, 1904a; Yeo & Neal, 2004).
Based on the definition put forward by Fox, Erner and Walters (2016), an individual will for the purposes of this study be considered risk averse if he or she prefers a certain or risky option to a riskier option with equal or higher expected value. Conversely, an individual will be considered risk seeking, if he/she prefers a risky option to a certain or less risky option with higher expected value.
Various theoretical explanations have been put forward to explain why cognitive ability and risk aversion might be negatively related. One prominent explanation based on dual process theory (Evans & Stanovich, 2013; Kahneman & Frederick, 2002; Loewenstein & O’Donoghue, 2004) is that people with high cognitive ability are more reflective and, thus, less likely to make judgement and decision errors (Benjamin et al., 2013). According to dual-process theory, judgment and decision-making is the result of an interaction between two distinct cognitive processes; type 1 and type 2 (Evans & Stanovich, 2013). Type 1 are fast, automatic, low-effort and high-capacity processes, usually associated with heuristic and intuitive decision-making (Evans & Stanovich, 2013; Frankish, 2010). Type 2 are conversely, slow, controlled, high-effort and low capacity processes, typically associated with deliberate, reflective and rational decision-making (Evans & Stanovich, 2013; Frankish, 2010). Given that type 2 processes are assumed to tax working memory capacity (Evans & Stanovich, 2013; Stanovich, 2010), which is known to be highly correlated with cognitive ability (Conway, Kane & Engle, 2003; Kyllonen & Christal, 1990; Süß, Oberauer, Wittmann, Wilhelm, & Schulze, 2002), it is likely that people with high cognitive ability are more capable of engaging in reflective and rational decision-making. The dual-process explanation holds that people with high cognitive ability are likely to realize that risk aversion over small stakes is irrational (Rabin, 2000; Rabin & Thaler, 2001), because they have more cognitive capacity to deliberately reflect and think about their choices. In support of this argument, Cokely and Kelley (2009) found that highly intelligent individuals were more likely to engage in expected value maximization, report more elaborate and reflective thought patterns, and spend more time deliberating when choosing between prospects. Moreover, many other studies have shown that people with high cognitive ability display fewer behavioral biases across a wide range of decision tasks that arguably require type 2 processes to derive what is considered to be the normative response (e.g., Bergman, Ellingsen, Johannesson & Svensson, 2010; Hoppe & Kusterer, 2011; Oechssler, Roider & Schmitz, 2009; Stanovich & West, 1998; Toplak, West & Stanovich, 2011).
A similar explanation is that people with high cognitive ability are more likely to bracket their choices broadly; considering the bearing of their experimental decisions in a broader lifetime perspective (Dohmen et al., 2010; Koch & Nafziger, 2016; Read, Loewenstein & Rabin, 1999). Theoretically, this makes sense, as broad bracketing is cognitively taxing compared to narrow bracketing (Read et al., 1999), increasing the likelihood that people with low cognitive ability engages less in broad bracketing due to a lack of cognitive resources. Hence, given that broad bracketing has been linked with lower levels of risk aversion (Gneezy & Potters, 1997; Hilgers & Wibral, 2014; Thaler, Tversky, Kahneman & Schwartz, 1997), it is not unlikely that broad bracketing is one of the driving forces behind the negative relationship between cognitive ability and risk aversion observed in some previous studies.
A third possible explanation is that risk preferences play a role in the development of cognitive ability, and that individual risk preferences influence people’s choice of environment, which in turn could affect cognitive development (Dohmen et al., 2018). As an example, risk preferences might play a role in choices about investment in education, which has been shown to foster the development of cognitive abilities (Falch & Sandgren Massih, 2011; Ritchie, Bates & Deary, 2015; Schneeweis, Skirbekk & Winter-Ebmer, 2014). On the other hand, it is of course possible that people with high cognitive ability seek out environments which foster the development of risk tolerance. For instance, several studies have shown that people with high cognitive ability are more active in the stock market (Christelis, Jappelli & Padula, 2010; Grinblatt, Keloharju & Linnainmaa, 2011; Van Rooij, Lusardi & Alessie, 2011), which could lead them to become more risk tolerant over time.
Finally, it could be that the relationship between cognitive ability and risk aversion, is coevolutionary: meaning that certain configurations of cognitive ability and risk aversion have been evolutionary beneficial (Dohmen et al., 2010, 2018). Hence, evolutionary pressures might have created a general tendency for low cognitive ability to be coupled with risk aversion and vice versa.
In light of the mixed findings on the relationship between cognitive ability and risk aversion, the first aim of this study is to systematically investigate the nature of the relationship across the domain of gains, mixed and losses. In line with the existing literature, the second aim is to examine to what extent the choice architecture of the decision task used to elicit risk preferences influence the relationship between cognitive ability and risk aversion. The current study will also ask whether the relationship exists only when the decision task is unincentivized and purely hypothetical, and whether the relationship is influenced by how cognitive ability is measured. Finally, given that age (Defoe, Dubas, Figner & van Aken, 2015; Mata, Josef, Samanez-Larkin & Hertwig, 2011) and gender (Charness & Gneezy, 2012; Croson & Gneezy, 2009) have been found to be related to risk preferences, the last aim of this study is to investigate the influence of these variables on the relationship between cognitive ability and risk aversion.
In line with the guidelines provided by Cooper (2010) the systematic literature review and meta-analysis performed in this study comprised three steps: (1) literature search, (2) data extraction and coding, and (3) data analysis.
In order to identify studies examining the relationship between cognitive ability and risk aversion, the following four electronic databases were searched: Econlit, PsycInfo, Business Source Complete, and Academic Search Complete. All databases were searched using the following keywords in the first search field: “risk avers*” OR “loss avers*” OR “prospect theory” OR “expected utility” OR “risk toleran*” OR “risk preference*” OR “risk neutral” OR “risk attitude*”; and the following keywords in the second search field: “cognitive abilit*” OR “intelligence” OR “IQ” OR “cognitive skills” OR “mental abilit*” OR “cognitive function*” OR “cognitive performance” OR “intelligence quotient” OR “general mental abilit*” OR “cognitive capacit*” OR “mental capacit*” OR “intellectual function*”. The keywords from the two search fields were combined using the Boolean operator “AND”, leading to the final search string presented below: (“risk avers*” OR “loss avers*” OR “prospect theory” OR “expected utility” OR “risk toleran*” OR “risk preference*” OR “risk neutral” OR “risk attitude*”) AND (“cognitive abilit*” OR “intelligence” OR “IQ” OR “cognitive skills” OR “mental abilit*” OR “cognitive function*” OR “cognitive performance” OR “intelligence quotient” OR “general mental abilit*” OR “cognitive capacit*” OR “mental capacit*” OR “intellectual function*”)
The search was limited to studies written in English published from 1900 to 2018 and yielded a total of 692 hits. Next, Scopus was searched using the same combination of keywords in first and second search-field. The Scopus search was also limited to studies written in English, published from 1900 to 2018 and yielded a total of 658 hits. Finally, four independent searches on Google Scholar were conducted using the keywords: (1) “risk aversion” AND “cognitive ability”; (2) “risk aversion” AND “intelligence”; (3) “risk aversion” AND “mental ability”; (4) “risk aversion” AND “cognitive skills”. Each independent Google Scholar search resulted in somewhere between 625 and 19,900 hits, of which Google Scholar displayed the first thousand. All searches were conducted from 03.12.2018 to 11.12.2018. To supplement the electronic search, a manual search of reference lists of key empirical and theoretical articles was performed. The manual search yielded no additional studies. For all studies identified as relevant, title and abstract were screened for appropriate content and a total of 633 studies were extracted for full text screening. For an overview of the literature search process see Figure 1.
Studies were included for data extraction and coding if they reported either Pearson´s r, Spearman´s rho, means and standard deviations (i.e., descriptive statistics), or beta-coefficients for the relationship between cognitive ability and risk aversion. Studies were excluded if they (a) investigated decision-making under ambiguity, (b) relied on self-report measures of risk aversion, (c) used academic performance, literacy, reading proficiency, financial literacy, or educational attainment as proxies for cognitive ability, or (d) solely relied on participants experiencing any form of mental health problems or cognitive impairment. After carefully reviewing all 633 studies based on the inclusion and exclusion criteria, 287 studies were selected for coding and data extraction. More specifically, 111 studies were excluded because they relied upon self-report measures of risk aversion, while 114 studies were excluded for using either academic performance, literacy, reading proficiency, financial literacy or educational attainment as proxies for cognitive ability. Another 107 studies were excluded because they did not report data on either cognitive ability, risk aversion or both. Three studies were excluded because data were available only for participants with mental health problems or cognitive impairment. Finally, 11 studies were excluded for investigating decision-making under ambiguity.
In order to obtain as much data as possible, all corresponding authors were contacted via email and asked to provide the raw data or any relevant information on the relationship between cognitive ability and risk aversion in all three domains. The response rate was approximately 29%. Next, data was extracted from the remaining 205 studies from which the raw data was not obtained. Following, Peterson and Brown (2005), Pearson’s r was imputed from beta coefficients using the following formula whenever necessary: r = β + .05λ, where λ = 1 if β > 0 and λ = 0 if β < 0. In cases where only means and standard deviations were reported, Pearson´s r was computed by using the formulas provided by Borenstein et al. (2009). Whenever data for the same participants was reported across multiple outcomes, effect sizes were combined, in line with guidelines provided by Borenstein and colleagues (2009). In 134 studies out of the 287 studies included for data extraction, the information reported on the relationship between cognitive ability and risk aversion was insufficient. That is, even though these studies appeared to contain data on both cognitive ability and risk aversion neither Pearson´s r, Spearman’s rho, nor the data necessary to impute Pearson´s r were reported. Hence, data was available from 153 articles. Among these, several had overlapping data. To avoid using the same data multiple times, only one study per data set was included in the final analysis. In total, 97 studies were included for meta-analysis in the domain of gains, 41 in the mixed domain, and 12 in the domain of losses.
To allow for moderator analysis, studies were coded based on several different features. First, all studies were coded based on sample characteristics, including mean age of the participants, male to female ratio, and sample type (i.e., student, community or children). Second, studies were coded based on the class of decision task used to measure risk aversion. More specifically, each decision task was categorized based on whether it was incentivized, the probabilities and payoffs were varied or kept constant and if there was a certain option or not. The percentage of possible risk averse choices (i.e., the percentage of choices in which the riskier option had equal or higher expected value than the safer option) was also calculated if possible. Third, in order to investigate the extent to which the study purpose influenced results, all studies were coded based on whether or not one of their primary objectives was to investigate the relationship between cognitive ability and risk aversion. Fourth, studies were coded based on the psychometric measure used to assess cognitive ability (as described shortly), and whether or not participants received payment for participating in the experiment.
Figure 1: Overview of the literature search.
All studies included measured cognitive ability with one of the following psychometric measures: Cognitive Reflection Task (CRT), Raven´s Progressive Matrices (RPM), numeracy tests (NUM), working memory capacity tests (WMC), or cognitive ability test batteries (CATB).
CRT is a three-item instrument designed to measure cognitive ability and reflective thinking (Frederick, 2005). The task is frequently used in experimental research within the field of economics (e.g., Albaity, Rahman, & Shahidul, 2014; Corgnet et al., 2016; Deppe et al., 2015) and has been associated with other measures of cognitive ability such as the Wonderlic Personnel Test (Frederick, 2005).
RPM is a widely recognized nonverbal measure of fluid intelligence which has been used across a wide range of disciplines (Carpenter, Just & Shell, 1990; Raven, 2000). It consists of 3 x 3 matrices, in which the bottom right figure is missing and must be identified among several alternatives. The test-taker is instructed to look across the rows and/or down the columns to find a pattern and determine the missing entry. Importantly, the difficulty of the matrices is gradually increased, so that it requires greater mental capacity to determine the missing entry for each consecutive matrix (Raven, 2000).
NUM refers to a variety of tests designed to measure numerical ability. NUM usually consists of a range of mathematical problems to be solved without using a calculator (e.g., Cokely, Galesic, Schulz, Ghazal & Garcia-Retamero, 2012; Lipkus, Samsa & Rimer, 2001; Weller et al., 2013). Numerical ability has consistently been linked with numerous cognitive ability measures (e.g., Cokely et al., 2012; Cokely & Kelley, 2009; Del Missier, Mäntylä & De Bruin, 2012; Liberali, Reyna, Furlan, Stein & Pardo, 2012), and can be considered a reasonable measure of cognitive ability.
WMC typically consist of a set of tasks where the participant is asked to recall a number of items while performing an attention-demanding assignment (Engle, 2002). Working memory capacity has consistently been found to be highly correlated with general intelligence (Conway et al., 2003; Kyllonen & Christal, 1990), and is believed to be involved in a wide range of complex cognitive operations, such as comprehension, reasoning and problem solving (Conway et al., 2005; Engle, 2002).
CATB refers to comprehensive measures of intelligence where several instruments are used to assess different aspects of an individual’s cognitive ability. Common examples of such measures are the Wechsler Adult Intelligence Scale (WAIS; Wechsler, 2008), and the Stanford-Binet Intelligence Scale (SBIS; Roid, 2003), which both consist of no less than ten subtests (DiStefano & Dombrowski, 2006; Roid, 2003; Wechsler, 2008). Although CATB´s provide a comprehensive measure of cognitive ability, it is often not feasible to use such measures in experimental research, as they are time consuming and difficult to administer. Instead, most researchers either adopt a small number of subtests from a well-established CATB, or construct a less time consuming CATB by combining a few commonly used cognitive ability measures such as those mentioned above (e.g., RPM, CRT, NUM WMC, etc.). Accordingly, CATB will in this study refer to any measure utilizing more than one instrument to assess cognitive ability.
Across all three domains risk aversion was measured with one of the following decisions tasks: Bomb Risk Elicitation Task (BRET), Decision Task Battery (DTB), Eckel-Grossman Risk Task (EGRT), Ellsberg Urn Risk Task (EURT), Gift Gambling Task (GGT), Income Gambling Task (IGT), Lottery Task (LT), Multiple Price List (MPL), One-shot Gambling Task (OGT), Sabater-Grande-Georgantzis Lottery Panel (SGG), Wheel of Fortune Task (WFT), Cups Task (CT), Portfolio Choice Task (PCT), Budget Line Allocation Task (BLAT), Cambridge Gambling Task (CGT), Gneezy-Potters Investment Task (GPIT) or Adaptive Lottery Task (ALT). Specifically, risk aversion was measured with 13 different decision tasks in the domain of gains (i.e. ALT, BRET, CT, DTB, EGRT, EURT, GGT, IGT, LT, MPL, OGT, SGG, WTF), 12 in the mixed domain (i.e., ALT, BLAT, CGT, DTB, EGRT, GPIT, IGT, LT, MPL, OGT, PCT, SGG), and 6 in the domain of losses (i.e., ALT, CT, EGRT, GGT, LT, MPL).
BRET is a dynamic real time elicitation task in which the participant is required to decide how many boxes to collect in a matrix containing 100 boxes, one of which hides a bomb (Crosetto & Filippin, 2013). The payoff of each box collected is exactly the same. Hence, the potential earning increases linearly. In case the box with the bomb is collected, the payoff for the whole round is zero. As all outcomes, as well as the probabilities associated with each outcome, is fully specified, BRET allows for a good estimation of individual risk preferences in the domain of gains, simply by counting the number of boxes collected (Crosetto & Filippin, 2013; Holzmeister & Pfurtscheller, 2016).
EGRT is a simple risk elicitation method in which the participant is asked to choose between one of six gambles (Dave, Eckel, Johnson & Rojas, 2010; Eckel & Grossman, 2008). Each gamble typically involves a 50% chance of winning a low payoff and a 50% chance of winning a high payoff. One of the gambles is a sure thing, in which the low and high payoff is exactly equal. The gambles are designed so that the expected payoff increases linearly with risk, as represented by the standard deviation (Charness, Gneezy & Imas, 2013). A risk averse individual should thus choose gambles with lower standard deviations whereas a risk neutral individual should choose the gamble with the highest expected return.
In EURT, participants are presented with an urn containing five blue and five yellow balls. For each round a random ball is drawn from the urn, and participants are asked to guess its color. If the participants guess correctly, they win a specified amount of money. Before the ball is drawn, however, each participant is asked to indicate the price they are willing to sell the bet for. A computer then generates a random offer to buy the bet. If this sum is higher than the minimum selling price set by the participant, the bet is sold and no ball is drawn from the urn. If the offer is lower than the minimum selling price, a ball is drawn and the bet is carried out. Risk aversion is inferred based on the minimum selling price set by the participant. A high selling price indicates risk tolerance while a low selling price suggests risk aversion (Borghans, Heckman, Golsteyn & Meijers, 2009).
The GGT is a simple decision task often used to elicit risk preferences among children (Levin & Hart, 2003). The participant is presented with four identical boxes, two of which are placed to the left of the participant and two of which are placed to the right. Under each box on the left side, a small gift is hidden, whereas two small gifts are hidden under one of the boxes on the right. Risk aversion is measured by asking the participant to indicate from which side he or she would like to draw a box. As the expected value of the two sides are equal, participants are considered risk averse if they prefer to draw a box from the left side.
MPL refers to a class of decision tasks in which participants are asked to choose between two different lotteries (Dohmen et al., 2018). MPL generally comes in two formats: The first format involves two lotteries in which the potential outcome of each lottery are kept constant, while the probabilities of the outcomes vary from row to row (e.g., Holt & Laury, 2002); the second format involves a safe and a risky lottery, in which the probabilities of outcomes are kept constant, while the potential outcomes of either the safe or risky lottery are gradually increased (e.g. Andersson et al., 2016). Risk preferences are inferred either based on the number of risky choices made, or on the participant’s unique switching point (i.e., the point where the participant switched from the risky to the safe lottery).
OGT refers to a simple type of decision tasks in which the participant is presented with only one choice between a safe/risky option and a riskier option with equal or higher expected value. In this task, risk aversion is inferred based on whether the participant chose the riskiest option or not.
In IGT participants are asked to consider several hypothetical income gambles. More specifically, the participants are asked to choose between a certain income for some specified amount of time or a gamble in which this income is either increased or decreased by some amount with probability p and 1–p (e.g., Barsky, Juster, Kimball & Shapiro, 1997; Beauchamp et al., 2017). Based on the number of rejected gambles, individual risk preferences can be determined.
LT refers to any decision task in which the participants are asked to choose between a number of gambles sequentially. Each set of gambles can be constructed in a number of different ways so that the probabilities and payoffs associated with each gamble changes or are kept constant. Moreover, each gamble may differ with regard to whether the participants has to choose between two different gambles, or a certain option and a gamble. As with most decision tasks, risk aversion is inferred based on the number of risky and safe option chosen by the participant.
SGG is a standard risk elicitation task in which participants are asked to choose one gamble from four different lottery panels (Sabater-Grande & Georgantzis, 2002). Each panel consists of ten gambles with decreasing probabilities and increasing expected value. Consequently, if the participant chooses the first gamble in each lottery panel, he or she can be considered highly risk averse. If the participant, on the other hand, chooses the last gamble in each lottery panel he or she can be considered risk tolerant.
WFT is a visual gambling task in which the participants are asked to make a series of choices between pairs of fortune wheels (Blankenstein, Crone, van den Bos & van Duijvenvoorde, 2016). The first fortune wheel is always presented as a certain option that pays some specified amount of money. The second fortune wheel, on other hand, is presented as a risky option in which the magnitude of the monetary outcome and the probability of obtaining this outcome varies. Accordingly, risk aversion is inferred based on the number of times each participant prefers the first over the second fortune wheel.
CT is another visual gambling task in which participants are asked to choose between 54 gambles presented as two arrays of cups containing monetary payoffs (Levin, Weller, Pederson & Harshman, 2007). In each trial, participants are asked to decide from which of two arrays of two, three or five cups containing monetary payoffs they would like to draw a cup. One of the two arrays is a certain option in which all of the cups contain the same payoff whereas the second array is a risky option in which only one of the cups contains a monetary payoff. In some of the gambles, the risky option has the same expected value as the certain option while in others the expected value is either higher or lower for the risky option. Risk aversion is estimated based on the number of times the participant decides to draw a cup from the certain array.
PCT is a decision task in which the participants are asked to rank their most and least preferred investment options from a menu of three investment portfolios: safe, risky and intermediate (e.g., Bateman, Stevens & Lai, 2015). The safe option guarantees an annual return of x% while the risky option provides a mean annual return of x% + y% with a standard deviation of z%. The intermediate option is dynamically rebalanced so that 50% is invested in the safe and the risky option. The mean annual return of the intermediate option is, thus, the average of the safe and risky option with a standard deviation of z%/2. A highly risk averse investor would, in this setup, always prefer the safe option to the intermediate and risky option, as well as the intermediate option to the risky option. Consequently, risk aversion is estimated based on how each participant ranks the attractiveness of the three portfolios described above.
In BLAT participants are asked to allocate points between accounts x and y, which are represented visually on a two-dimensional budget line (Choi, Fisman, Gale & Kariv, 2007; Choi, Kariv, Müller & Silverman, 2014). After allocating points, either x or y is randomly chosen, and the participant receives the points he or she allocated to the chosen account, while all points in the other account is lost. On each budget line, there are three points: A, B and C. Point A is where the budget line hits the y-axis and represents allocating all points to the y account. Conversely, B is where the budget line hits the x-axis and represents allocating all points to the x account. Finally, point C, which lies on the 45-degree line, ensures a certain payoff and corresponds to an equal allocation between x and y. Importantly, the slope of the budget line AB is always chosen so that the payoff of choosing an allocation between A and C has a higher expected return than point C, whereas choosing an allocation between B and C has a lower expected return than C. Hence, an individual who is infinitely risk averse will always choose an allocation equal to C, whereas an individual who is less risk averse or risk seeking will choose an allocation between A and C or B and C, respectively. This makes it possible to estimate individual risk preferences based on the amount of points allocated between A and C, and B and C on the budget line.
GPIT is a classic investment task in which the participant have to decide how much to invest ($x), out of an initial endowment ($y), in a risky asset (e.g., Charness, Gneezy & Imas, 2013; Gneezy & Potters, 1997). The amount invested yields a dividend of $kx (k > 1) with probability p and is lost with probability 1–p. The money not invested ($y–x) is kept by the participant. The payoff of each choice is therefore $y–x+kx, with probability p, and $y–x with probability 1–p. In all cases k and p is chosen so that the expected value of investing is either higher or equal to the expected value of not investing. Risk aversion is estimated based on the amount invested, with lower amounts indicating higher levels of risk aversion.
In CGT a yellow token is hidden under one of ten blue or red boxes (e.g., Clark et al., 2008). The amount of red and blue boxes varies from trial to trial, so that the probability that the token is hidden under a blue or red box, changes. On each trial, participants have to decide how much to wager out of their current endowment, that the yellow token is hidden under either a red or a blue box. If the participant chooses the right color, the amount wagered is added to his or her current endowment. Conversely, if the participant chooses the wrong color the amount is lost. Just like in the GPIT, risk aversion is inferred based on the amount wagered on each trial.
ALT is similar to the standard LT, in which participants are asked to choose between a number of gambles sequentially. However, as opposed to the standard LT, the gambles in ALT is iteratively adapted based on the participant’s choices, allowing for a more efficient and precise estimation of individual risk preferences (e.g., Chapman, Snowberg, et al., 2018; Frey, Pedroni, Mata, Rieskamp & Hertwig, 2017).
Finally, DTB refers to measures of risk aversion relying on more than one single elicitation task. That is any measure in which two or more of the decision tasks described above were used to construct a composite score of risk aversion within the domain of gains, mixed or losses.
First, all effect sizes were converted into a common metric (i.e., correlation coefficients), as previously described. Correlations were defined as negative when people with higher cognitive ability were to be less risk averse. In line with the guidelines provided by Borenstein et al. (2009), all correlation coefficients were converted into Fisher’s z. Next, a random-effects model meta-analysis using the restricted maximum likelihood estimator (REML; Viechtbauer, 2005, 2010) was performed in order to investigate the relationship between cognitive ability and risk aversion for the domains of gains, mixed and losses. Moreover, two additional meta-analyses were conducted in each of these three domains, one using only males and one using only females. A random-effects model was chosen, as opposed to a fixed-effect model, because the assumptions behind the random-effects model tend to be more realistic (Borenstein et al., 2009; Cooper, 2010). Results from the meta-analyses is presented as a correlation, ρ, equivalent to Pearson’s r. Correlations ranging from .10 to .29, .30 to .49 and .50 to 1.00 are interpreted as weak, moderate and strong, respectively (Cohen, 1988).
In order to test for heterogeneity, Q and I2 statistics were calculated. The Q statistic was computed by summing the squared deviations of each study’s effect from the combined effect size, weighting each study by its inverse variance (Huedo-Medina, Sánchez-Meca, Marín-Martínez & Botella, 2006). The Q statistic tests for heterogeneity by testing the null hypothesis that all studies share a common effect size (Borenstein et al., 2009). Under the null hypothesis, the Q statistic follows a chi-square distribution with k–1 degrees of freedom, k being the number of studies included in the meta-analysis (Huedo-Medina et al., 2006). A significant Q indicates that true heterogeneity exists (Borenstein et al., 2009). The I2 statistic investigates the amount of true heterogeneity by dividing the result of the Q statistic and its degrees of freedom (k–1) by the Q value, and multiplying it by 100 (Huedo-Medina et al., 2006). Consequently, the I2 statistic can be interpreted as the percentage of total variance in a set of observed effect sizes due to true heterogeneity. Higgins, Thompson, Deeks and Altman (2003) suggest that I2 approximating 25%, 50%, and 75% can be considered as low, moderate, and high, respectively.
To investigate the impact of moderator variables, several meta-regressions were performed. Meta-regressions are analogous to standard regression analysis, and can, with appropriate coding, be used to examine the influence of both categorical and continuous moderator variables (Hedges & Pigott, 2004; Viechtbauer, 2010). All moderator analyses were performed independently, as testing multiple moderators simultaneously may lead to a mis-estimation of moderator effects, especially when the number of studies included is small (Steel & Kammeyer-Mueller, 2002).
Publication bias, the tendency to leave out non-significant results and publish only positive results, was examined in two steps. First, it was visually assessed using a funnel plot of all studies included in the random-effects model meta-analysis. If no publication bias exists, the two sides of the funnel plot should be symmetrical (Borenstein et al., 2009; Rothstein, Sutton & Borenstein, 2006). That is, if no publication bias exists, the observed effect sizes should not be asymmetrically distributed around the combined effect size. Second, a rank correlation test (Begg & Mazumdar, 1994) and a regression test (Egger, Smith, Schneider & Minder, 1997) was performed to test for funnel plot asymmetry.
Finally, case deletion diagnostics were performed in order to identify any influential studies and/or possible outliers (Viechtbauer, 2010; Viechtbauer & Cheung, 2010). According to Viechtbauer (2010), studies might be considered either as influential or as outliers if one or more of the following statements are true: (a) the absolute DFFITS value is larger than 3√p/(k–p) where p is the number of model coefficients and k the number of studies; (b) the lower tail area of a chi-square distribution with p degrees of freedom cutoff by the Cook’s distance is larger than .50; (c) the hat value is larger than 3(p/k) or (d) the DFBETAS value is larger than 1. The DFFITS value is an estimate of how many standard deviations the predicted effect for the ith study changes after excluding the ith study from the model fitting. Cook´s distance is essentially the Mahalanobis distance between the full set of predicted values with or without the ith study included in the model fitting. The hat value is simply the ith diagonal element of the hat matrix, also known as the so-called leverage of the ith study. Finally, the DFBETAS value indicates how many standard deviations the estimated correlations coefficient changes after removing the ith study from the model fitting.
All statistical analyses were performed in R (R Core Team, 2017) with the following packages installed: metafor (Viechtbauer, 2010) and dplyr (Wickham, François, Henry & Müller, 2018).
As previously described, a total of 97 studies published between 2003 and 2018 were included for meta-analysis in the domain of gains (N = 90,723). The mean age of participants was available for 66 studies and ranged from 6.0 to 81.2 years with a mean of 29.5. Participants were either university, college or high school students in 56 of the 97 studies included. Out of the remaining 41 studies, 35 were based on various community samples, while 5 relied on samples of children. For the last study the specifics of the sample used was not available. In 35 studies there were more males than females, while the opposite was true in 42 studies. The male to female ratio was exactly 1.00 in one study while the proportion of males and females was unavailable for 19 studies. Risk aversion was measured using MPL in 45 studies, LT in 26, OGT in 7, DTB in 5, EGRT in 4 and BRET in 3. In the remaining 7 studies risk aversion was assessed with one of the following decision tasks: ALT, CT, EURT, GGT, IGT, SGG, and WFT. The decision task was fully incentivized in 23 studies, randomly incentivized in 47, and purely hypothetical in 14. Moreover, participants were paid for participation in 81 out of 97 studies. Information about whether the participants were paid and the extent to which the decision task was incentivized were unavailable in 16 and 13 studies, respectively. The average payment for the whole experiment ranged from $5 to $125 with a mean of $30. The average payment was, however, only available for 34 studies. Cognitive ability was measured using CATB in 36 studies, CRT in 30, RPM in 18, NUM in 12 and WMC in 1. Finally, in 24 of the 97 studies included, one of the primary purposes of the study was to investigate the relationship between cognitive ability and risk aversion. For an overview of the studies included for meta-analysis in the domain of gains see Table 1.
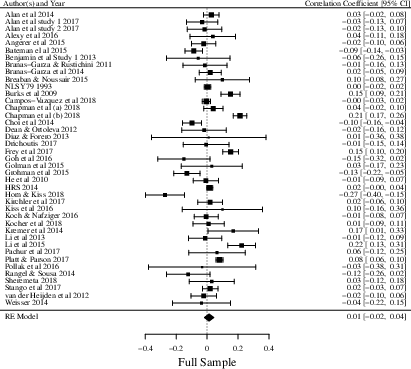
Results from the random-effects model meta-analysis suggest that there exist a weak but significant negative relationship between cognitive ability and risk aversion in the domain of gains (k = 97, ρ = −.07, Z = −6.11, p < .001, 95% CI [−.10, −.05]). Looking at the results for males (k = 51, ρ = −.09, Z = − 4.81, p < .001, 95% CI [−.12, −.05]) and females only (k = 48, ρ = −.05, Z = −4.39, p < .001, 95% CI [−.08, −.03]) a similar pattern emerges. The forest plots depicted in Figure 2 provides an overview of the studies included, their individual correlation coefficients with 95% confidence intervals, and the overall results from the random-effects model meta-analyses.
Figure 2: Forest plots for the domain of gains — full sample, males and females only. 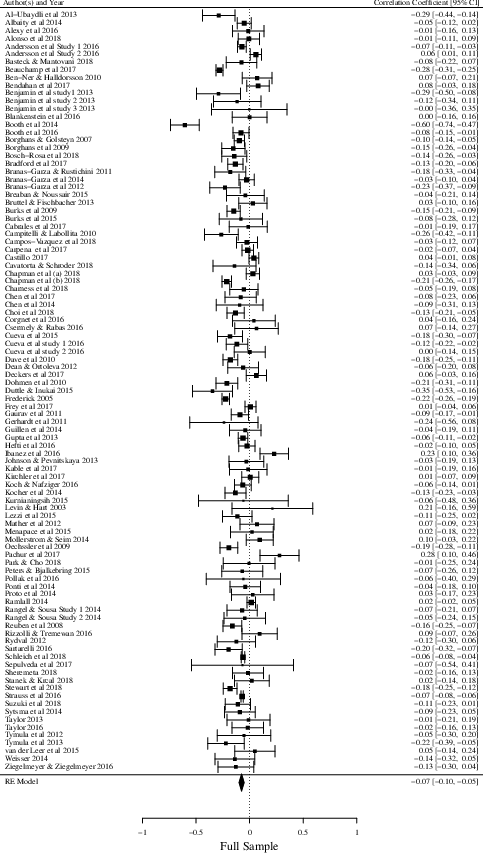
Figure 2 continued.
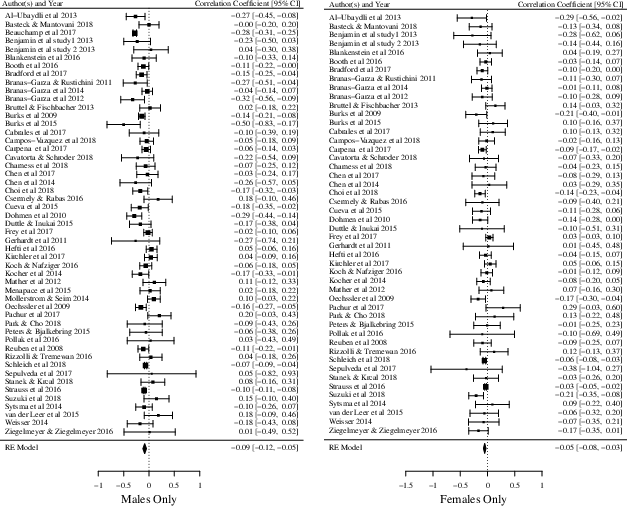
The results from the Q statistics were highly significant for the full sample (Q = 612.83, df = 96, p <.001) as well as for males only (Q = 210.79, df = 50, p < .001), indicating the presence of true heterogeneity. The Q statistic for females only, however, was not significant (Q = 60.38, df = 47, p >.05), suggesting that only a small amount of true heterogeneity exist between the studies included when looking exclusively at the results for females. These results were further confirmed by the I2 statistics which indicated that the amount of total variance observed due to true heterogeneity was high for the full sample (I2 = 88.69%, 95% CI [83.49, 92.09]) and males only (I2 = 78.48%, 95% CI [60.85, 89.44]), but low for females (I2 = 33.56%, 95% CI [.00, 72.33]).
The results from the meta-regressions showed that none of the moderator variables had any influence on the relationship between cognitive ability and risk aversion in the domain of gains for the full sample and males only (see Table 2–3). Looking at the results for females only, the meta-regressions suggest that both the decision task used, and the payoff structure of the riskier choice explained a substantial amount of the observed heterogeneity (Table 4). Specifically, the relationship between cognitive ability and risk aversion is stronger when the payoff of the riskier choice is kept constant compared to when it changes. Even though the overall result of the meta-regressions suggests that the decision task used to measure risk aversion explains a substantial amount of the observed heterogeneity for females only, no single tasks appeared to significantly influence the relationship between cognitive ability and risk aversion.
A total of 41 studies published from 1993 to 2018 were included for meta-analysis in the mixed domain (N = 50,936). The mean age of participants was available for 27 studies and ranged from 8.9 to 75.4 years with a mean of 31.9. Participants were either university, college or high school students in 17 of 41 studies included. Out of the remaining 24 studies 18 were based on various community samples, while 6 relied on samples of children. In 12 studies there were more males than females, while the opposite was true in 18 studies. The male to female ratio was exactly 1.00 in one study while the proportion of males and females was not available for 10 studies. Risk aversion was measured using GPIT in 11 studies, LT in 9, and MPL in 8. ALT, BLAT, OGT and IGT were all used to measure risk aversion in 2 studies, while EGRT, CGT, DTB, PCT and SGG were used in the remaining 5 studies. The decision task was fully incentivized in 11 studies, randomly incentivized in 14, and purely hypothetical in 11. Moreover, participants were paid for participating in the experiment in 31 out 41 studies. Information about whether participants were paid for their participation and the extent to which the decision task was incentivized was unavailable in 10 and 5 studies, respectively. The average payment for the whole experiment ranged from $2 to $58 with a mean of $21. However, information about the average payment was only available for 10 studies. Cognitive ability was measured using CATB in 19 studies, CRT in 9, RPM in 8, and NUM in 5. Finally, in 5 of the 41 studies included, one of the primary purposes of the study was to investigate the relationship between cognitive ability and risk aversion. For an overview of studies included for meta-analysis in the mixed domain see Table 5.
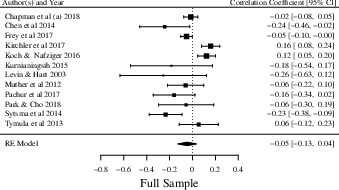
Results from the random-effects model meta-analysis indicate no relationship between cognitive ability and risk aversion in the mixed domain (k = 41, ρ = .01, Z = 0.82, p > .05, 95% CI [−.02, .04]). The same goes for the result for males only (k = 24, ρ = −.01, Z = −0.32, p > .05, 95% CI [−.05, .04]). However, the result for females only suggest a weak but significant positive relationship between cognitive ability and risk aversion in the mixed domain (k = 24, ρ = .03, Z = 2.15, p < .05, 95% CI [.00, .06]). The forest plots depicted in Figure 3 provide an overview of the included studies, their individual correlation coefficients with 95% confidence intervals, and the overall results from the random-effects model meta-analyses described above.
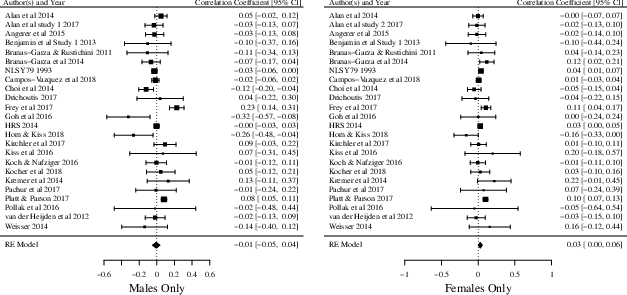
Figure 3: Forest plot for the mixed domain — full sample, males and females only.
Results from the Q statistics were highly significant for the full sample (Q = 247.07, df = 40, p < .001), males (Q = 86.42, df = 23, p < .001), and females only (Q = 45.57, df = 23, p < .01), indicating a substantial amount of true heterogeneity among the 41 studies included in the mixed domain. These results were further confirmed by the I2 statistics which indicated that the amount of total variance observed due to true heterogeneity was high for the full sample (I2 = 88.49%, 95% CI [79.25, 92.88]) and males (I2 = 80.74%, 95% CI [58.75, 92.55]), while moderate for females (I2 = 54.65%, 95% CI [7.97, 82.23).
The overall results from the meta-regression showed that only the cognitive ability measure and the decision task used had an influence on the relationship between cognitive ability and risk aversion in the mixed domain (Table 6). More specifically, the relationship between cognitive ability and risk aversion is positive when cognitive ability was measured with CATB, while increasingly negative when assessed by RPM, CRT and NUM. Similarly, the meta-regressions suggest that the relationship between cognitive ability and risk aversion is positive when risk aversion was measured using ALT, while less positive and even negative when one of the following decision tasks were utilized: CGT, MPL, IGT, OGT, LT, GPIT, BLAT, PCT or EGRT.
For males only, the decision task used, probabilities and whether or not there was a certain option were found to be significant predictors (Table 7). Specifically, the relationship between cognitive ability and risk aversion is positive when the probabilities of the decision task was changing as well as when there was no certain option, while negative when the opposite was true. Moreover, the relationship was found to be increasingly positive when risk aversion was measured using CGT and DTB.
For females only, cognitive ability measure, the decision task used, probabilities, and whether or not there was a certain option were significant predictors for the relationship of interest (Table 8.). More specifically, the relationship between cognitive ability and risk aversion is positive when cognitive ability was measured using CATB while increasingly negative when assessed by RPM and CRT. Similarly, the relationship is positive when risk aversion was measured using ALT, while moving toward negative when using GPIT and BLAT. Finally, the relationship between cognitive ability and risk aversion is stronger when there was no certain option and the probabilities were changing.
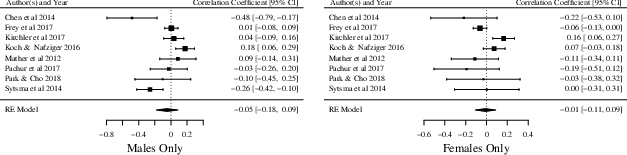
Figure 4: Forest plots in the domain of losses — full sample, males and females only
A total of 12 studies published from 2003 to 2018 were included for meta-analysis in the domain of losses (N = 4,544). The mean age of participants was available for 11 studies and ranged from 6.0 to 68.7 years with a mean of 32.1. Participants were either university, college or high school students in 4 of 12 studies. Out of the remaining 8 studies, 7 were based on various community samples, while one relied on samples of children. In 6 studies there were more males than females, while the opposite was true in 5 studies. For one study, the proportion of males and females was not available. Risk aversion was measured using LT in 6 studies and MPL in 2. In the remaining 4 studies risk aversion was assessed with one of the following decision tasks: ALT, CT, EGRT and GGT. The decision task was fully incentivized in 2 studies and randomly incentivized in 7. Moreover, participants were paid for participation in 10 out of 12 studies. Information about whether the participants were paid for their participation and the extent to which the decision task was incentivized were unavailable in 2 and 3 studies, respectively. The average payment for the whole experiment ranged from $9 to $25 with a mean of $15. The average payment was however only available for 3 studies. Cognitive ability was measured using CATB in 9 studies, CRT in 2 and RPM in 1. Finally, in 4 of the 12 studies included, one of the primary purposes of the study was to investigate the relationship between cognitive ability and risk aversion. For an overview of the studies included for meta-analysis in the domain of losses see Table 9.
Results from the random-effects model meta-analysis indicate no link between cognitive ability and risk aversion in the domain of losses (k = 12, ρ = −.05, Z = −1.10, p > .05, 95% CI [−.13, .04]). The story is the same for males only (k = 8, ρ = −.05, Z = −0.68, p > .05, 95% CI [−.18, .09]) and females only (k = 8, ρ = −.01, Z = −0.19, p > .05, 95% CI [−.11, .09]). The forest plots in Figure 4 provides an overview of the studies included, their individual correlation coefficients with 95% confidence intervals, and the overall results from the random-effects model meta-analyses described above.
The result from the Q statistics were significant for the full sample (Q = 50.63, df = 11, p < .001), males (Q = 29.18, df = 7, p < .001), and females only (Q = 19.10, df = 7, p < .01), indicating the existence of true heterogeneity. These results were further corroborated by the I2 statistics which indicated that the amount of total variance observed due to true heterogeneity was high for the full sample (I2 = 82.13%, 95% CI [56.30, 94.07]) and males (I2 = 81.15%, 95% CI [51.46, 96.43]) as well as moderate for females (I2 =63.26%, 95% CI [8.58, 90.88]).
The meta-regressions indicate that cognitive ability measure, probabilities, and the payoff structure of the riskier choice had a significant influence on the relationship between cognitive ability and risk aversion in the domain of losses (Table 10). More specifically, the relationship is positive when cognitive ability was measured using CRT, while increasingly negative when measured using either CATB or RPM. Furthermore, the relationship between cognitive ability and risk aversion is positive when the probability was kept constant at 50% and the payoff of the riskier option did not change, while negative when this was not the case.
For males only, both the payoff structure of the safer choice and the decision task used to measure risk aversion were significant predictors of the relationship of interest (Table 11). The relationship between cognitive ability and risk aversion is positive when risk aversion was measured using MPL, while increasingly negative when assessed with either EGRT or CT. Moreover, the relationship moved in the negative direction when the payoff of the safer choice was kept constant.
For females only, the percentage of risk averse choices, cognitive ability measure, probabilities, sample type, and the payoff structure of the riskier choice influenced the relationship between cognitive ability and risk aversion for males only (Table 12). The result for percentage of risk averse choices suggest that the relationship of interest moves in a negative direction as the percentage of risk averse choices increases. Moreover, the relationship between cognitive ability and risk aversion is negative when cognitive ability was measured with CATB, while going in the opposite direction when assessed by CRT. Conversely, the relationship is positive when the probability was kept constant at 50%, the sample consisted of students, and the payoff of the riskier choices was kept constant, while negative when this was not the case.
In order to compare the results for males and females across the domain of gains, mixed and losses, three separate meta-regressions were performed. The results indicate no significant differences between males and females in the domain of gains (QM (df = 1) = 2.43, p > .05), mixed (QM (df = 1) = 2.02, p >.05) or losses (QM (df = 1) = 0.19, p >.05). These results corroborate findings from Table 2, 6 and 10 that the male to female ratio has no influence on the relationship between cognitive ability and risk aversion in either of the three domains.
Nine funnel plots were created by plotting each effect size against the standard error of the observed effect sizes for the full sample, males and females only across all three domains (Figure 5–7). Visual examination of each funnel plot suggests that the observed effect sizes are not asymmetrically distributed around the combined effect size, implying that no publication bias exist. Furthermore, neither the rank correlation test nor the regression test for funnel plot asymmetry provides any substantial evidence of publication bias for the full sample (Gains: τ = −.01, p > .05, Z = 0.91, p > .05; Mixed: τ = .08, p > .05, Z = −0.97, p > .05; Losses: τ = −.12, p > .05; Z = −2.10, p < .05), males (Gains: τ = −.06, p > .05; Z = 0.64, p > .05; Mixed: τ = .08, p > .05; Z = −1.35, p > .05; Losses: τ =-.36, p > .05; Z = −1.56, p > .05), and females only (Gains: τ = .07, p > .05, Z = −0.11, p > .05; Mixed: τ = .14, p > .05; Z = −0.56, p > .05; Losses:τ =-.14, p > .05; Z = −1.29, p > .05) across the domain of gains, mixed and losses.
As shown in Figures 8–10, two studies were found to be influential when looking at the results for the full sample across the three decision domains. Similarly, when looking at the results for males only, two studies were identified as influential across the domain of gains, mixed and losses, while four studies could be regarded as influential for females only. The results did however not change substantially after removing all studies identified as influential from the full sample (Gains: k = 96, ρ = −.07, Z = −6.31, p < .001, 95% CI [−.09, −.05]; Mixed: k = 40, ρ = .02, Z = 1.35, p > .05, 95% CI [−.01, .05]), males (Gains: k = 50, ρ = −.08, Z = −4.94, p < .001, 95% CI [−.11, −.05]; Losses: k = 7, ρ = .00, Z = −0.00, p > .05, 95% CI [−.11, .11]) and females only (Gains: k = 45, ρ = −.06, Z = −4.39, p < .001, 95% CI [−.09, −.03]; Mixed: k = 23, ρ = .02, Z = 2.28, p < .05, 95% CI [.00, .04]).
In this study a systematic review and meta-analysis was conducted in order to empirically investigate the nature of the relationship between cognitive ability and risk aversion. A total of 97 studies (N=90,723) was included for meta-analysis in the domain of gains, 41 (N=50,936) in the mixed domain and 12 (N=4,544) in the domain of losses. The overall results from the random-effects model meta-analyses suggest that a weak, but significant relation between cognitive ability and risk aversion exist in the domain of gains. Thus, the current meta-analysis provides evidence that highly intelligent individuals tend to be less risk averse in the domain of gains. However, the strength of the relationship between cognitive ability and risk aversion was estimated to be rather weak (ρ = −.07), and not as strong as suggested by some previous studies. No evidence was found for a relationship between cognitive ability and risk aversion in the mixed domain or the domain of losses. Taken together, these results suggest that the relationship between cognitive ability and risk aversion is domain specific and present only for the domain of gains. Given the weak nature of this relationship, we should be cautious in drawing conclusions about its practical significance.
Interestingly, the relationship between cognitive ability and risk aversion appear to be quite stable across genders. That is, even though the relationship between cognitive ability and risk aversion appears to differ somewhat between males and females for the domains of gains (ρmale = −.09; ρfemale = −.05), mixed (ρmale = −.01; ρfemale = .03) and losses (ρmale = −.05; ρfemale = −.01), these differences were not found to be significant. This is important, as it suggests that the observation that females tend to be more risk averse than males (e.g., Charness & Gneezy, 2012; Croson & Gneezy, 2009), is probably not driven by gender differences in cognitive ability. Contrary, to the results from the full sample and males only, a significant positive relationship between cognitive ability and risk aversion was observed in the mixed domain for females only. This suggest that highly intelligent females tend to be more risk averse in the mixed domain, compared to females with lower cognitive ability. However, as with the negative correlation observed in the domain of gains, the relationship is very weak (ρ = .03), and, thus, potentially not of practical significance. Notably, the amount of true heterogeneity observed, were consistently higher for males as compared to females across all three domains (Gains [Imale2 = 78.48%, Ifemale2 =33.56%]; Mixed [Imale2 = 80.74%, Ifemale2 = 54.65%], Losses [Imale2 =81.15%, Ifemale2 = 63.26%]. This is an interesting result, as it suggests that the relationship between cognitive ability and risk aversion is considerably more stable and varies less across studies for females. A possible explanation is that males show more variability in cognitive ability than females (e.g., Arden & Plomin, 2006; Deary, 2003; Feingold, 1992; Lakin, 2013; Lohman & Lakin, 2009; Strand, Deary & Smith, 2006). This is in line with the greater male variability hypothesis, which states that males generally tend to differ more than females on a number of individual characteristics such as personality (Borkenau, McCrae, & Terracciano, 2013), creativity (He & Wong, 2011), and cognitive ability (Arden & Plomin, 2006; Deary, 2003; Feingold, 1992; Lakin, 2013; Lohman & Lakin, 2009; Strand et al., 2006). Consequently, the relationship between cognitive ability and risk aversion might be less stable across studies for males, because the sample of male participants in each study is more likely to vary in terms of cognitive ability. This is, likely due to the fact that the variation between samples depends partially on the amount of variability in the population from which they are drawn (Swinscow & Campbell, 2002).
The fact that the relationship between cognitive ability and risk aversion is non-existent or rather weak across all three domains suggest that risk preferences may reflect an independent construct which does not substantially overlap with intelligence. This interpretation is line with the conclusion drawn by Frey and colleagues (2017), who used several risk elicitation measures to extract a latent risk preference factor (R) which was not found to be associated with cognitive ability. This is very intriguing as cognitive ability has been found to be strongly related to how proficient people are at understanding and evaluating risk (Cokely et al., 2012). Consequently, in some cases there appear to be a gap between people’s ability to understand and evaluate risk, and their willingness to take risk. This gap could potentially have important real-world implications as it might lead some people who have a limited understanding of risk to take on too much of it, while others who do have the capabilities to properly evaluate risk might take on too little.
Compared to other meta-analyses linking cognitive ability to individual preferences, the effect sizes reported here are small. For instance, Shamosh and Gray (2008) found the mean correlation between cognitive ability and delayed discounting across 24 studies to be −.23, suggesting that highly intelligent individuals are more patient and have higher levels of self-control. Similarly, in a more recent meta-analysis Sharma, Bottom and Elfenbein (2013), found a positive mean correlation of .24 between cognitive ability and cooperative tendencies across five studies with a total of 1,123 participants. Hence, even though cognitive ability was not found to be strongly related to risk aversion in the present meta-analysis, it should still be regarded as an important variable that needs to be taken into consideration when investigating the antecedents of human decision making.
Overall, none of the moderator variables consistently influenced the relationship between cognitive ability and risk aversion across the domain of gains, mixed and losses. Although no clear pattern from the meta-regressions emerged, the following five moderators were found to be influential in more than one instance: the decision task used to measure risk aversion, the psychometric instrument used to assess cognitive ability, whether the payoff of the riskier choice and probabilities varied or were kept constant, and if there was a certain option or not. Specifically, the decision task used to measure risk aversion consistently moderate the relationship in the mixed domain, while also moderating the relationship in the domain of gains for females and the domain of losses for males. This result suggest that the relationship between cognitive ability and risk aversion is especially sensitive to how risk aversion is assessed in the mixed domain, while only somewhat sensitive to this in the domain of gains and losses.
Similarly, the psychometric measure used to assess cognitive ability was found to influence the relationship between cognitive ability and risk aversion for the full sample and females only in the mixed domain, and the domain of losses. As with the results for the decision task used to measure risk aversion, these results indicate that it somehow matters more how cognitive ability is assessed in the mixed domain and the domain of losses as compared to the domain of gains.
Whether the probabilities were varied or kept constant was not found to moderate the relationship between cognitive ability and risk aversion in the domain of gains, but to be somewhat influential in the mixed domain and the domain of losses. More precisely, it was found to influence the relationship between cognitive ability and risk aversion in the mixed domain for males and females only, as well as in the domain of losses for the full sample and females only. Likewise, whether or not there was a certain option was found to moderate the relationship in the mixed domain for males and females only. In both cases, the relationship between cognitive ability and risk aversion is positive when there was no certain option and less positive when the opposite was true. Finally, whether the payoff of the riskier option was kept constant or varied was found to moderate the relationship in the domain of gains for females, as well as in the domain of losses for the full sample and females only.
Collectively, these results indicate that the relationship between cognitive ability and risk aversion is more sensitive to the setup of the decision task, as well as how cognitive ability is measured in the mixed domain and the domain of losses.
In contrast to the results from Taylor (2013, 2016) and Sousa and Rangel (2014), no evidence of a hypothetical bias was observed. Hence, neither the existence nor the strength of the relationship between cognitive ability and risk aversion were found to be contingent on whether the decision task was incentivized or not. Furthermore, contrary to the results presented by Andersson et al. (2016), the number of possible risk averse choices was not found to moderate the relationship, except in the domain of losses for females only. These results suggest that the negative relationship observed between cognitive ability and risk aversion in the domain of gains is most likely not just an artefact of people with low cognitive ability making more random choice errors.
Across all three domains there was no substantial evidence of publication bias when looking at the funnel plots as well as the results from the rank correlation tests (Begg & Mazumdar, 1994) and the regression tests (Egger et al., 1997). Furthermore, the moderator analyses indicate that results were not influenced by whether or not one of the primary purposes of the study was to investigate the relationship between cognitive ability and risk aversion. All in all, these results strengthen the conclusions drawn from current meta-analysis, as they suggest that the estimated effect sizes are not considerably skewed in any direction due to publication bias.
This study is the first to systematically review and synthesize data on the relationship between cognitive ability and risk aversion. Furthermore, it is the first study that systematically explores the circumstances under which the relationship between cognitive ability and risk aversion exist, as well as whether specific factors moderate it. Despite these strengths, some limitations should be acknowledged.
First, several scholars have pointed out that many of the decision tasks most commonly used to elicit risk preferences are subject to a considerable amount of measurement error (Crosetto & Filippin, 2016; Frey et al., 2017; Pedroni et al., 2017). Given that the measurement error associated with any two measures naturally impose an upper limit for the correlation that can be expected between them (Muchinsky, 1996; Spearman, 1904b), it is likely that the current meta-analysis underestimates the true strength of the relationship between cognitive ability and risk aversion. In light of this fact, it would have been more appropriate to conduct the meta-analysis using disattenuated correlations (Osborne, 2008). Unfortunately, this was not possible, because the data needed to correct for attenuation (i.e., reliability estimates for both the decision task and cognitive ability measure) was rarely available or impossible to obtain. On the other hand, it is important to note that correcting for attenuation when the reliability estimate drops below .70 can lead to overestimation of the strength of the relationship of interest (Osborne, 2008). Accordingly, given that the measurement error, associated with many of the decision tasks commonly used to elicit risk preferences, is far from zero, correcting for attenuation would have been problematic in the context of the current meta-analysis.
Second, the systematic literature search as well as all the coding and data-extraction procedures was only performed by one individual. This is a limitation as it naturally increases the risk of human errors (Mathes, Klaßen & Pieper, 2017).
Third, recent evidence suggest that the imputation of beta values, proposed by Peterson and Brown (2005), could be somewhat problematic, as it has been found to produced overly small estimates of meta-analytic mean correlations (Roth, Le, Oh, Van Iddekinge & Bobko, 2018). Although this clearly presents a limitation, the meta-regressions suggests that the results were not significantly influenced by whether or not Pearson’s r was imputed using the Peterson and Brown (2005) formula. Hence, even though the imputation proposed by Peterson and Brown (2005) generally tend to produce overly small estimates of meta-analytic mean correlations (Roth et al., 2018), this does not appear to be a severe problem in the current meta-analysis.
Finally, only a few studies were identified and included for meta-analysis in the domain of losses, making the meta-analytic results for this domain less convincing compared to the results for the mixed domain and the domain of gains (Borenstein et al., 2009). Moreover, given that the number of studies included in domain of losses was so small (k = 12) the conclusions drawn from the meta-regressions should be taken with extreme caution (Steel & Kammeyer-Mueller, 2002; Thompson & Higgins, 2002).
Although the current meta-analysis sheds light on a number of important aspects concerning the relationship between cognitive ability and risk aversion, there is still much work to be done. Future studies should seek to gain a more comprehensive understanding of the circumstances under which a negative relationship between cognitive ability and risk aversion in the domain of gains exists. Looking at the results from the meta-regressions, it is clear that the moderator variables investigated do not sufficiently explain the high amount of heterogeneity observed in the domain of gains. Furthermore, additional studies are needed before any definite conclusions about the relationship between cognitive ability and risk aversion in the domain of losses can or should be drawn.
Another potentially fruitful line of research is to consider the possibility that the relationship between cognitive ability and risk aversion is nonlinear. In a recent study, Mandal and Roe (2014) used NLSY79 and HRS to investigate this possibility and found a quadratic pattern where respondents with the highest and lowest cognitive ability were most risk tolerant. This is intriguing, as it suggests that the inconsistent findings on the relationship between cognitive ability and risk aversion could be explained by the relationship being nonlinear. Following Mandal and Roe (2014) future studies should, therefore, set out to ask whether the relationship is indeed better described as quadratic and nonlinear.
Finally, as many of the decision tasks most commonly used to elicit risk preferences are subjected to a considerable amount of measurement error (Crosetto & Filippin, 2016; Frey et al., 2017; Pedroni et al., 2017), future studies should strive to develop new and better ways of measuring individual risk preferences. In this regard, a promising line of research is the recent development of adaptive elicitations tasks which have been found to reduce measurement error and outperform standard elicitation procedures on a number of important parameters (Chapman, Snowberg, et al., 2018; Toubia, Johnson, Evgeniou & Delquié, 2013). Another viable solution would be to use different risk elicitation tasks to extract a common risk factor (R), thereby increasing accuracy and reducing measurement error (Frey et al., 2017). Extending this possibility, risk could be measured in a variety of domains, both to study effects in each domain and to extract a cross-domain general factor (e.g., Harris, Jenkins & Glaser, 2006).
In conclusion, the current meta-analysis provides strong evidence for a significant but weak negative relationship between cognitive ability and risk aversion in the domain of gains. However, no significant relationship was found in the mixed domain or the domain of losses, suggesting that the relationship is domain specific. Importantly, no significant difference was observed between males and females across the domain of gains, mixed and losses. Moreover, none of the moderator variables investigated in this study consistently influenced the relationship between cognitive ability and risk aversion across all three domains. Future research should aim to gain a deeper understanding of the relationship between cognitive ability and risk aversion using more reliable measures to elicit risk preferences.
Al-Ubaydli, O., Jones, G., & Weel, J. (2013). Patience, cognitive skills, and coordination in the repeated stag hunt. Journal of Neuroscience, Psychology, and Economics, 6(4), 71–96. https://doi.org/10.1037/npe0000005.
Alan, S., Baydar, N., Boneva, T., Crossley, T. F., & Ertac, S. (2017). Transmission of risk preferences from mothers to daughters. Journal of Economic Behavior & Organization, 134, 60–77.
Alan, S., & Ertac, S. (2014). Good things come to those who (are taught how to) wait: Results from a randomized educational intervention on time preference. Available at SSRN 2566405.
Albaity, M., Rahman, M., & Shahidul, I. (2014). Cognitive reflection test and behavioral biases in Malaysia. Judgment and Decision Making, 9(2), 148–151.
Alexy, M., Georgantzis, N., Kácer, M., & Péliová, J. (2016). Risk attitude elicitation methods: Do they tell similar stories? Ekonomicky Casopis, 64(9), 847–877.
Alonso, J., Di Paolo, R., Ponti, G., & Sartarelli, M. (2018). Facts and Misconceptions about 2D: 4D, Social and Risk Preferences. Frontiers in Behavioral Neuroscience, 12, 22.
Andersson, O., Holm, H. J., Tyran, J.-R., & Wengström, E. (2016). Risk aversion relates to cognitive ability: Preferences or noise? Journal of the European Economic Association, 14(5), 1129–1154. https://doi.org/10.1111/jeea.12179.
Angerer, S., Lergetporer, P., Glätzle-Rützler, D., & Sutter, M. (2015). How to measure time preferences in children: a comparison of two methods. Journal of the Economic Science Association, 1(2), 158–169.
Ann Arbor, M. (2014). Health and Retirement Study, ([RAND HRS Longitudinal Fil 2014 (v.2))]) public use dataset. Produced and Distributed by the University of Michigan with Funding from the National Institute on Aging (Grant Number NIA U01AG009740).
Arden, R., & Plomin, R. (2006). Sex differences in variance of intelligence across childhood. Personality and Individual Differences, 41(1), 39–48. https://doi.org/10.1016/j.paid.2005.11.027.
Barsky, R. B., Juster, F. T., Kimball, M. S., & Shapiro, M. D. (1997). Preference parameters and behavioral heterogeneity: An experimental approach in the health and retirement study. The Quarterly Journal of Economics, 112(2), 537–579.
Basteck, C., & Mantovani, M. (2018). Cognitive ability and games of school choice. Games and Economic Behavior, 109, 156–183.
Bateman, H., Stevens, R., & Lai, A. (2015). Risk information and retirement investment choice mistakes under Prospect Theory. Journal of Behavioral Finance, 16(4), 279–296. https://doi.org/10.1080/15427560.2015.1095749.
Beauchamp, J. P., Cesarini, D., & Johannesson, M. (2017). The psychometric and empirical properties of measures of risk preferences. Journal of Risk and Uncertainty, 54(3), 203–237. https://doi.org/10.1007/s11166-017-9261-3.
Begg, C. B., & Mazumdar, M. (1994). Operating characteristics of a rank correlation test for publication bias. Biometrics, 1088–1101.
Ben-Ner, A., & Halldorsson, F. (2010). Trusting and trustworthiness: What are they, how to measure them, and what affects them. Journal of Economic Psychology, 31(1), 64–79.
Bendahan, S., Goette, L., Thoresen, J., Loued-Khenissi, L., Hollis, F., & Sandi, C. (2017). Acute stress alters individual risk taking in a time-dependent manner and leads to anti-social risk. European Journal of Neuroscience, 45(7), 877–885.
Benjamin, D. J., Brown, S. A., & Shapiro, J. M. (2013). Who is ‘behavioral’? Cognitive ability and anomalous preferences. Journal of the European Economic Association, 11(6), 1231–1255.
Bergman, O., Ellingsen, T., Johannesson, M., & Svensson, C. (2010). Anchoring and cognitive ability. Economics Letters, 107(1), 66–68.
Blankenstein, N. E., Crone, E. A., van den Bos, W., & van Duijvenvoorde, A. C. K. (2016). Dealing with uncertainty: Testing risk- and ambiguity-attitude across adolescence. Developmental Neuropsychology, 41(1–2), 77–92. https://doi.org/10.1080/87565641.2016.1158265.
Booth, A., Cardona-Sosa, L., & Nolen, P. (2014). Gender differences in risk aversion: Do single-sex environments affect their development? Journal of Economic Behavior & Organization, 99, 126–154. https://doi.org/10.1016/j.jebo.2013.12.017.
Booth, A., Fan, E., Meng, X., & Zhang, D. (2016). Gender differences in willingness to compete: The role of culture and institutions. IZA Discussion Papers, No. 10364, Institute for the Study of Labor (IZA), Bonn. Retrieved from https://www.econstor.eu/handle/10419/149223.
Borenstein, M., Hedges, L. V., Higgins, J. P. T., & Rothstein, H. R. (2009). Introduction to meta-analysis (1st ed.). The Atrium, Southern Gate, Chichester, West Sussex, PO19 8SQ, United Kingdom: John Wiley and Sons Ltd.
Borghans, L., & Golsteyn, B. H. H. (2007). Are courses chosen to reduce skill-deficiencies? an experimental approach. Working paper). Maastricht University, Research Centre for Education and the Labour Market (ROA
Borghans, L., Heckman, J. J., Golsteyn, B. H. H., & Meijers, H. (2009). Gender differences in risk aversion and ambiguity aversion. Journal of the European Economic Association, 7(2–3), 649–658.
Borkenau, P., McCrae, R. R., & Terracciano, A. (2013). Do men vary more than women in personality? A study in 51 cultures. Journal of Research in Personality, 47(2), 135–144. https://doi.org/10.1016/j.jrp.2012.12.001.
Bosch-Rosa, C., Meissner, T., & Bosch-Domènech, A. (2018). Cognitive bubbles. Experimental Economics, 21(1), 132–153.
Bradford, D., Courtemanche, C., Heutel, G., McAlvanah, P., & Ruhm, C. (2017). Time preferences and consumer behavior. Journal of Risk and Uncertainty, 55(2–3), 119–145.
Branas-Garza, P., Espín, A. M., & Neuman, S. (2014). Religious pro-sociality? Experimental evidence from a sample of 766 Spaniards. PloS One, 9(8), e104685.
Brañas-Garza, P., Garcia-Munoz, T., & González, R. H. (2012). Cognitive effort in the beauty contest game. Journal of Economic Behavior & Organization, 83(2), 254–260.
Branas-Garza, P., & Rustichini, A. (2011). Organizing effects of testosterone and economic behavior: not just risk taking. PloS One, 6(12), e29842.
Breaban, A., & Noussair, C. N. (2015). Trader characteristics and fundamental value trajectories in an asset market experiment. Journal of Behavioral and Experimental Finance, 8, 1–17.
Bruttel, L., & Fischbacher, U. (2013). Taking the initiative. What characterizes leaders? European Economic Review, 64, 147–168.
Bureau of Labor Statistics U.S. Department of Labor. (n.d.). National Longitudinal Survey of Youth 1979 cohort, 1979–2012 (rounds 1-25). Produced and Distributed by the Center for Human Resource Research, The Ohio State University. Columbus, OH: 2014.
Burks, S. V, Carpenter, J. P., Goette, L., & Rustichini, A. (2009). Cognitive skills affect economic preferences, strategic behavior, and job attachment. Proceedings of the National Academy of Sciences, 106(19), 7745–7750.
Burks, S. V, Lewis, C., Kivi, P. A., Wiener, A., Anderson, J. E., Götte, L., … Rustichini, A. (2015). Cognitive skills, personality, and economic preferences in collegiate success. Journal of Economic Behavior & Organization, 115, 30–44.
Cabrales, A., Espín, A., Kujal, P., & Rassenti, S. (2017). Humans’(incorrect) distrust of reflective decisions. SSRN Electronic Journal. https://doi.org/10.2139/ssrn.2938434.
Campitelli, G., & Labollita, M. (2010). Correlations of cognitive reflection with judgments and choices. Judgment and Decision Making, 5(3), 182–191.
Campos-Vazquez, R. M., Medina-Cortina, E. M., & Velez-Grajales, R. (2018). Cognitive ability and economic preferences: evidence from survey and experimental data in Mexico’’. Economics Bulletin, 38(3), 1406–1414.
Carpena, F., Cole, S., Shapiro, J., & Zia, B. (2017). The ABCs of financial education: experimental evidence on attitudes, behavior, and cognitive biases. Management Science, 65(1), 346–369.
Carpenter, P. A., Just, M. A., & Shell, P. (1990). What one intelligence test measures: a theoretical account of the processing in the Raven Progressive Matrices Test. Psychological Review, 97(3), 404–431.
Carroll, J. B. (1997). Psychometrics, intelligence, and public perception. Intelligence, 24(1), 25–52.
Castillo, M. (2017). Negative childhood experiences and risk aversion: evidence from children exposed to domestic violence. In Technical Report. ICES.
Cavatorta, E., & Schroder, D. (2018). Measuring ambiguity preferences: a new ambiguity preference survey module. SSRN Electronic Journal. https://doi.org/10.2139/ssrn.2659596.
Chapman, J., Dean, M., Ortoleva, P., Snowberg, E., & Camerer, C. (2018). Econographics. National Bureau of Economic Research.
Chapman, J., Snowberg, E., Wang, S., & Camerer, C. (2018). Loss attitudes in the us population: Evidence from Dynamically Optimized Sequential Experimentation (DOSE). National Bureau of Economic Research.
Charness, G., & Gneezy, U. (2012). Strong evidence for gender differences in risk taking. Journal of Economic Behavior & Organization, 83(1), 50–58.
Charness, G., Gneezy, U., & Imas, A. (2013). Experimental methods: Eliciting risk preferences. Journal of Economic Behavior & Organization, 87, 43–51.
Charness, G., Rustichini, A., & Van de Ven, J. (2018). Self-confidence and strategic behavior. Experimental Economics, 21(1), 72–98.
Chen, Y., Jiang, M., & Krupka, E. L. (2017). Hunger and the gender gap. Experimental Economics, 1–33.
Chen, Y., Wang, J., Kirk, R. M., Pethtel, O. L., & Kiefner, A. E. (2014). Age differences in adaptive decision making: the role of numeracy. Educational Gerontology, 40(11), 825–833.
Choi, S., Fisman, R., Gale, D., & Kariv, S. (2007). Consistency and heterogeneity of individual behavior under uncertainty. American Economic Review, 97(5), 1921–1938.
Choi, S., Kariv, S., Müller, W., & Silverman, D. (2014). Who is (more) rational? American Economic Review, 104(6), 1518–1550.
Choi, S., Kim, J., Lee, E., & Lee, J. (2018). Probability Weighting and Cognitive Ability.Working paper.
Christelis, D., Jappelli, T., & Padula, M. (2010). Cognitive abilities and portfolio choice. European Economic Review, 54(1), 18–38.
Clark, L., Bechara, A., Damasio, H., Aitken, M. R. F., Sahakian, B. J., & Robbins, T. W. (2008). Differential effects of insular and ventromedial prefrontal cortex lesions on risky decision-making. Brain, 131(5), 1311–1322.
Cohen, J. (1988). Statistical power analysis for the behavioral sciences (Vol. 2). Hillsdale, NJ: Erlbaum Associates.
Cokely, E. T., Galesic, M., Schulz, E., Ghazal, S., & Garcia-Retamero, R. (2012). Measuring risk literacy: The Berlin Numeracy Test. Judgment and Decision Making,7(1), 25–47.
Cokely, E. T., & Kelley, C. M. (2009). Cognitive abilities and superior decision making under risk: A protocol analysis and process model evaluation. Judgment and Decision Making, 4(1), 20–33.
Conway, A. R. A., Kane, M. J., Bunting, M. F., Hambrick, D. Z., Wilhelm, O., & Engle, R. W. (2005). Working memory span tasks: A methodological review and user’s guide. Psychonomic Bulletin & Review, 12(5), 769–786.
Conway, A. R. A., Kane, M. J., & Engle, R. W. (2003). Working memory capacity and its relation to general intelligence. Trends in Cognitive Sciences, 7(12), 547–552. https://doi.org/10.1016/j.tics.2003.10.005.
Cooper, H. M. (2010). Research Synthesis and Meta-Analysis: A Step-by-Step Approach (5th ed.). Thousand Oaks, California: Sage Publication, Inc.
Corgnet, B., Espín, A. M., Hernán-González, R., Kujal, P., & Rassenti, S. (2016). To trust, or not to trust: Cognitive reflection in trust games. Journal of Behavioral and Experimental Economics, 64, 20–27. https://doi.org/10.1016/j.socec.2015.09.008.
Crosetto, P., & Filippin, A. (2013). The “bomb” risk elicitation task. Journal of Risk and Uncertainty, 47(1), 31–65.
Crosetto, P., & Filippin, A. (2016). A theoretical and experimental appraisal of four risk elicitation methods. Experimental Economics, 19(3), 613–641.
Croson, R., & Gneezy, U. (2009). Gender differences in preferences. Journal of Economic Literature, 47(2), 448–474.
Csermely, T., & Rabas, A. (2016). How to reveal people’s preferences: Comparing time consistency and predictive power of multiple price list risk elicitation methods. Journal of Risk and Uncertainty, 53(2–3), 107–136.
Cueva, C., Iturbe-Ormaetxe, I., Mata-Pérez, E., Ponti, G., Sartarelli, M., Yu, H., & Zhukova, V. (2016). Cognitive (ir)reflection: New experimental evidence. Journal of Behavioral and Experimental Economics, 64, 81–93. https://doi.org/10.1016/j.socec.2015.09.002.
Cueva, C., & Rustichini, A. (2015). Is financial instability male-driven? Gender and cognitive skills in experimental asset markets. Journal of Economic Behavior & Organization, 119, 330–344. https://doi.org/10.1016/j.jebo.2015.08.014.
Dave, C., Eckel, C. C., Johnson, C. A., & Rojas, C. (2010). Eliciting risk preferences: When is simple better? Journal of Risk and Uncertainty, 41(3), 219–243.
Dean, M., & Ortoleva, P. (2012). Estimating the relationship between economic preferences: A testing ground for unified theories of behavior. Mimeo, California Insitute of Technology.
Deary, I. (2003). Population sex differences in IQ at age 11: the Scottish mental survey 1932. Intelligence, 31(6), 533–542. https://doi.org/10.1016/S0160-2896(03)00053-9.
Deckers, T., Falk, A., Kosse, F., Pinger, P. R., & Schildberg-Hörisch, H. (2017). Socio-economic status and inequalities in children’s IQ and economic preferences. SSRN Electronic Journal. https://ssrn.com/abstract=3081390.
Defoe, I. N., Dubas, J. S., Figner, B., & van Aken, M. A. G. (2015). A meta-analysis on age differences in risky decision making: Adolescents versus children and adults. Psychological Bulletin, 141(1), 48–84. https://doi.org/10.1037/a0038088.
Del Missier, F., Mäntylä, T., & De Bruin, W. B. (2012). Decision-making competence, executive functioning, and general cognitive abilities. Journal of Behavioral Decision Making, 25(4), 331–351.
Deppe, K. D., Gonzalez, F. J., Neiman, J. L., Jacobs, C., Pahlke, J., Smith, K. B., & Hibbing, J. R. (2015). Reflective liberals and intuitive conservatives: A look at the Cognitive Reflection Test and ideology. Judgment & Decision Making, 10(4), 314–331.
Díaz, S., & Forero, C. (2013). The role of risk attitudes in probabilistic environments. SSRN Electronic Journal. https://ssrn.com/abstract=2408091.
DiStefano, C., & Dombrowski, S. C. (2006). Investigating the theoretical structure of the Stanford-Binet. Journal of Psychoeducational Assessment, 24(2), 123–136.
Dohmen, T., Falk, A., Huffman, D., & Sunde, U. (2010). Are Risk Aversion and Impatience Related to Cognitive Ability? American Economic Review, 100(3), 1238–1260. https://doi.org/10.1257/aer.100.3.1238.
Dohmen, T., Falk, A., Huffman, D., & Sunde, U. (2018). On the Relationship between Cognitive Ability and Risk Preference. Journal of Economic Perspectives, 32(2), 115–134. https://doi.org/10.1257/jep.32.2.115.
Drichoutis, A. C., & Nayga, R. (2017). Economic rationality under cognitive load.Working paper. https://mpra.ub.uni-muenchen.de/88192/.
Duttle, K., & Inukai, K. (2015). Complexity aversion: influences of cognitive abilities, culture and system of thought. Economic Bulletin, 35(2), 846–855.
Eckel, C. C., & Grossman, P. J. (2008). Men, women and risk aversion: Experimental evidence. Handbook of Experimental Economics Results, 1, 1061–1073.
Egger, M., Smith, G. D., Schneider, M., & Minder, C. (1997). Bias in meta-analysis detected by a simple, graphical test. Bmj, 315(7109), 629–634.
Engle, R. W. (2002). Working memory capacity as executive attention. Current Directions in Psychological Science, 11(1), 19–23.
Evans, J. S. B. T., & Stanovich, K. E. (2013). Dual-process theories of higher cognition: Advancing the debate. Perspectives on Psychological Science, 8(3), 223–241.
Eysenck, H. . J. (1998). Intelligence: A new look. London, England: Transaction.
Falch, T., & Sandgren Massih, S. (2011). The effect of education on cognitive ability. Economic Inquiry, 49(3), 838–856.
Feingold, A. (1992). Sex differences in variability in intellectual abilities: A new look at an old controversy. Review of Educational Research, 62(1), 61–84.
Fox, C. R., Erner, C., & Walters, D. J. (2016). Decision under risk: From the field to the laboratory and back. The Wiley Blackwell Handbook of Judgment and Decision Making, 1, 43–88.
Frankish, K. (2010). Dual-Process and Dual-System Theories of Reasoning. Philosophy Compass, 5(10), 914–926. https://doi.org/10.1111/j.1747-9991.2010.00330.x.
Frederick, S. (2005). Cognitive reflection and decision making. Journal of Economic Perspectives, 19(4), 25–42.
Freund, P. A., & Kasten, N. (2012). How smart do you think you are? A meta-analysis on the validity of self-estimates of cognitive ability. Psychological Bulletin, 138(2), 296–321. https://doi.org/10.1037/a0026556.
Frey, R., Pedroni, A., Mata, R., Rieskamp, J., & Hertwig, R. (2017). Risk preference shares the psychometric structure of major psychological traits. Science Advances, 3(10), e1701381. https://doi.org/10.1126/sciadv.1701381.
Gaurav, S., Cole, S., & Tobacman, J. (2011). Marketing complex financial products in emerging markets: Evidence from rainfall insurance in India. Journal of Marketing Research, 48(SPL), S150–S162.
Gerhardt, H., Biele, G. P., Heekeren, H. R., & Uhlig, H. (2016). Cognitive load increases risk aversion. SFB 649 Discussion Paper.
Gneezy, U., & Potters, J. (1997). An experiment on risk taking and evaluation periods. The Quarterly Journal of Economics, 112(2), 631–645.
Goh, J. O. S., Su, Y.-S., Tang, Y.-J., McCarrey, A. C., Tereshchenko, A., Elkins, W., & Resnick, S. M. (2016). Frontal, striatal, and medial temporal sensitivity to value distinguishes risk-taking from risk-aversive older adults during decision making. Journal of Neuroscience, 36(49), 12498–12509.
Golman, R., Loewenstein, G., & Gurney, N. (2015). Information gaps for risk and ambiguity. SSRN Electronic Journal. http://dx.doi.org/10.2139/ssrn.2605495.
Gottfredson, L. S. (1997). Mainstream science on intelligence: An editorial with 52 signatories, history, and bibliography. Intelligence, 24(1), 13–23. https://doi.org/10.1016/S0160-2896(97)90011-8.
Grinblatt, M., Keloharju, M., & Linnainmaa, J. (2011). IQ and stock market participation. The Journal of Finance, 66(6), 2121–2164.
Grohmann, A., Kouwenberg, R., & Menkhoff, L. (2015). Childhood roots of financial literacy. Journal of Economic Psychology, 51, 114–133.
Guillen, P., & Hakimov, R. (2014). Monkey see, monkey do: truth-telling in matching algorithms and the manipulation of others. WZB Discussion Paper.
Gupta, S. (2013). NREGs–Correcting for the ‘Accident’ of Birth? A Study of the Determinants of Risk Aversion in Andhra Pradesh, India.
Harris, C. R., Jenkins, M., & Glaser, D. (2006). Gender differences in risk assessment: Why do women take fewer risks than men? Judgment and Decision Making, 1, 48–63.
He, Q., Xue, G., Chen, C., Lu, Z., Dong, Q., Lei, X., … Chen, C. (2010). Serotonin transporter gene-linked polymorphic region (5-HTTLPR) influences decision making under ambiguity and risk in a large Chinese sample. Neuropharmacology, 59(6), 518–526.
He, W., & Wong, W. (2011). Gender differences in creative thinking revisited: Findings from analysis of variability. Personality and Individual Differences, 51(7), 807–811. https://doi.org/10.1016/j.paid.2011.06.027.
Hedges, L. V, & Pigott, T. D. (2004). The Power of Statistical Tests for Moderators in Meta-Analysis. Psychological Methods, 9(4), 426–445. https://doi.org/10.1037/1082-989X.9.4.426.
Hefti, A., Heinke, S., & Schneider, F. (2016). Mental capabilities, trading styles, and asset market bubbles: theory and experiment. Working Paper Series, University of Zurich, Department of Economics.
Higgins, J. P. T., Thompson, S. G., Deeks, J. J., & Altman, D. G. (2003). Measuring inconsistency in meta-analyses. BMJ, 327(7414), 557–560.
Hilgers, D., & Wibral, M. (2014). How malleable are choice brackets? The case of myopic loss aversion. University of Bonn, Mimeo.
Holt, C. A., & Laury, S. K. (2002). Risk aversion and incentive effects. American Economic Review, 92(5), 1644–1655.
Holzmeister, F., & Pfurtscheller, A. (2016). oTree: The “bomb” risk elicitation task. Journal of Behavioral and Experimental Finance, 10, 105–108.
Hoppe, E. I., & Kusterer, D. J. (2011). Behavioral biases and cognitive reflection. Economics Letters, 110(2), 97–100.
Horn, D., & Kiss, H. J. (2018). Which preferences associate with school performance? — Lessons from an exploratory study with university students. PloS One, 13(2), e0190163.
Huedo-Medina, T. B., Sánchez-Meca, J., Marín-Martínez, F., & Botella, J. (2006). Assessing heterogeneity in meta-analysis: Q statistic or I2 index? Psychological Methods, 11(2), 193–206. https://doi.org/10.1037/1082-989X.11.2.193.
Ibáñez, M. I., Sabater-Grande, G., Barreda-Tarrazona, I., Mezquita, L., López-Ovejero, S., Villa, H., … Georgantzís, N. (2016). Take the Money and Run: Psychopathic Behavior in the Trust Game. Frontiers in Psychology, 7. https://doi.org/10.3389/fpsyg.2016.01866
Johnson, D. B., & Pevnitskaya, S. (2013). An Experimental Study of Crime: The Robbery Game. Working paper.
Kable, J. W., Caulfield, M. K., Falcone, M., McConnell, M., Bernardo, L., Parthasarathi, T., … Hornik, R. (2017). No effect of commercial cognitive training on brain activity, choice behavior, or cognitive performance. Journal of Neuroscience, 37(31), 7390–7402.
Kahneman, D., & Frederick, S. (2002). Representativeness revisited: Attribute substitution in intuitive judgment. In T. Gilovich, D. W. Griffin, & D. Kahneman (Eds.), Heuristics and biases: (pp. 49–82). New York, NY: Cambridge University Press.
Kirchler, M., Andersson, D., Bonn, C., Johannesson, M., Sørensen, E. Ø., Stefan, M., … Västfjäll, D. (2017). The effect of fast and slow decisions on risk taking. Journal of Risk and Uncertainty, 54(1), 37–59.
Kiss, H. J., Rodriguez-Lara, I., & Rosa-García, A. (2016). Think twice before running! Bank runs and cognitive abilities. Journal of Behavioral and Experimental Economics, 64, 12–19.
Koch, A. K., & Nafziger, J. (2016). Correlates of Narrow Bracketing. Working paper. Department of Economics and Business Economics, Aarhus University.
Kocher, M. G., Lucks, K. E., & Schindler, D. (2014). Unleashing Animal Spirits–Self-Control and Bubbles in Experimental Asset Markets. Working paper. Rationality and Competition Discussion Paper Series 81
Kocher, M. G., Schindler, D., Trautmann, S. T., & Xu, Y. (2018). Risk, time pressure, and selection effects. Experimental Economics, 22(1), 216–246. https://doi.org/10.1007/s10683-018-9576-1.
Kremer, M., Lee, J., Robinson, J., & Rostapshova, O. (2013). Behavioral biases and firm behavior: Evidence from Kenyan retail shops. American Economic Review, 103(3), 362–368.
Kurnianingsih, Y. A., Sim, S. K. Y., Chee, M. W. L., & Mullette-Gillman, O. (2015). Aging and loss decision making: increased risk aversion and decreased use of maximizing information, with correlated rationality and value maximization. Frontiers in Human Neuroscience, 9, 280.
Kyllonen, P. C., & Christal, R. E. (1990). Reasoning ability is (little more than) working-memory capacity?! Intelligence, 14(4), 389–433.
Lakin, J. M. (2013). Sex differences in reasoning abilities: Surprising evidence that male–female ratios in the tails of the quantitative reasoning distribution have increased. Intelligence, 41(4), 263–274. https://doi.org/10.1016/j.intell.2013.04.004.
Levin, I., & Hart, S. S. (2003). Risk preferences in young children: Early evidence of individual differences in reaction to potential gains and losses. Journal of Behavioral Decision Making, 16(5), 397–413.
Levin, I., Weller, J., Pederson, A., & Harshman, L. (2007). Age-related differences in adaptive decision making: Sensitivity to expected value in risky choice. Judgment and Decision Making, 2(4), 225–233.
Lezzi, E., Fleming, P., & Zizzo, D. J. (2015). Does it matter which effort task you use? A comparison of four effort tasks when agents compete for a prize. SSRN Electronic Journal. http://dx.doi.org/10.2139/ssrn.2594659.
Li, Y., Baldassi, M., Johnson, E. J., & Weber, E. U. (2013). Complementary cognitive capabilities, economic decision making, and aging. Psychology and Aging, 28(3), 595–613.
Li, Y., Gao, J., Enkavi, A. Z., Zaval, L., Weber, E. U., & Johnson, E. J. (2015). Sound credit scores and financial decisions despite cognitive aging. Proceedings of the National Academy of Sciences, 112(1), 65–69.
Liberali, J. M., Reyna, V. F., Furlan, S., Stein, L. M., & Pardo, S. T. (2012). Individual differences in numeracy and cognitive reflection, with implications for biases and fallacies in probability judgment. Journal of Behavioral Decision Making, 25(4), 361–381.
Lipkus, I. M., Samsa, G., & Rimer, B. K. (2001). General performance on a numeracy scale among highly educated samples. Medical Decision Making, 21(1), 37–44.
Loewenstein, G. F., & O’Donoghue, T. (2004). Animal spirits: Affective and deliberative processes in economic behavior. SSRN Electronic Journal. https://doi.org/10.2139/ssrn.539843.
Lohman, D. F., & Lakin, J. M. (2009). Consistencies in sex differences on the Cognitive Abilities Test across countries, grades, test forms, and cohorts. British Journal of Educational Psychology, 79(2), 389–407. https://doi.org/10.1348/000709908X354609.
Mandal, B., & Roe, B. E. (2014). Risk Tolerance among National Longitudinal Survey of Youth Participants: The Effects of Age and Cognitive Skills. Economica, 81(323), 522–543. https://doi.org/10.1111/ecca.12088.
Mata, R., Josef, A. K., Samanez-Larkin, G. R., & Hertwig, R. (2011). Age differences in risky choice: A meta-analysis. Annals of the New York Academy of Sciences, 1235(1), 18–29.
Mather, M., Mazar, N., Gorlick, M. A., Lighthall, N. R., Burgeno, J., Schoeke, A., & Ariely, D. (2012). Risk preferences and aging: The “certainty effect” in older adults’ decision making. Psychology and Aging, 27(4), 801–816.
Mathes, T., Klaßen, P., & Pieper, D. (2017). Frequency of data extraction errors and methods to increase data extraction quality: a methodological review. BMC Medical Research Methodology, 17(1), 152.
Menapace, L., Colson, G., & Raffaelli, R. (2015). A comparison of hypothetical risk attitude elicitation instruments for explaining farmer crop insurance purchases. European Review of Agricultural Economics, 43(1), 113–135.
Mollerstrom, J., & Seim, D. (2014). Cognitive ability and the demand for redistribution. PloS One, 9(10), e109955.
Muchinsky, P. M. (1996). The correction for attenuation. Educational and Psychological Measurement, 56(1), 63–75.
Murphy, K. R., & Davidshofer, C. O. (1998). Psychological testing (4th ed.). Princeton, NJ: Prentice-Hall.
Oechssler, J., Roider, A., & Schmitz, P. W. (2009). Cognitive abilities and behavioral biases. Journal of Economic Behavior & Organization, 72(1), 147–152. https://doi.org/10.1016/j.jebo.2009.04.018.
Osborne, J. W. (2008). Best Practices in Quantitative Methods. Thousand Oaks, California: SAGE Publications, Inc. https://doi.org/10.4135/9781412995627.
Pachur, T., Mata, R., & Hertwig, R. (2017). Who dares, who errs? Disentangling cognitive and motivational roots of age differences in decisions under risk. Psychological Science, 28(4), 504–518.
Park, I., & Cho, S. (2018). The influence of number line estimation precision and numeracy on risky financial decision making. International Journal of Psychology. https://doi.org/10.1002/ijop.12475.
Pedroni, A., Frey, R., Bruhin, A., Dutilh, G., Hertwig, R., & Rieskamp, J. (2017). The risk elicitation puzzle. Nature Human Behaviour, 1(11), 803–809.
Peters, E., & Bjalkebring, P. (2015). Multiple numeric competencies: When a number is not just a number. Journal of Personality and Social Psychology, 108(5), 802-822.
Peterson, R. A., & Brown, S. P. (2005). On the Use of Beta Coefficients in Meta-Analysis. Journal of Applied Psychology, 90(1), 175–181. https://doi.org/10.1037/0021-9010.90.1.175.
Platt, L., & Parsons, S. (2017). Is the future female? Educational and occupational aspirations of teenage boys and girls in the UK.
Pollak, Y., Oz, A., Neventsal, O., Rabi, O., Kitrossky, L., & Maeir, A. (2016). Do adolescents with attention-deficit/hyperactivity disorder show risk seeking? Disentangling probabilistic decision making by equalizing the favorability of alternatives. Journal of Abnormal Psychology, 125(3), 387–398.
Ponti, G., Rodriguez-Lara, I., & Di Cagno, D. (2014). Doing it now or later with payoff externalities: Experimental evidence on social time preferences. Working Papers= Documentos de Trabajo: Serie AD, (5), 1–49.
Proto, E., Rustichini, A., & Sofianos, A. (2014). Higher intelligence groups have higher cooperation rates in the repeated prisoner’s dilemma. SSRN Electronic Journal. https://ssrn.com/abstract=2505361.
R Core Team. (2017). R: A language and environment for statistical computing. Vienna, Austria: R Foundation for Statistical Computing.
Rabin, M. (2000). Risk Aversion and Expected-utility Theory: A Calibration Theorem. Econometrica, 68(5), 1281–1292. https://doi.org/10.1111/1468-0262.00158.
Rabin, M., & Thaler, R. H. (2001). Anomalies: risk aversion. Journal of Economic Perspectives, 15(1), 219–232.
Ramlall, I. (2014). Is there a pecking order in the demand for financial services in Mauritius? Journal of African Business, 15(1), 49–63.
Raven, J. (2000). The Raven’s progressive matrices: change and stability over culture and time. Cognitive Psychology, 41(1), 1–48.
Read, D., Loewenstein, G., & Rabin, M. (1999). Choice Bracketing. Journal of Risk and Uncertainty, 19(1/3), 171–197. https://doi.org/10.1023/A:1007879411489.
Reuben, E., Sapienza, P., & Zingales, L. (2008). A description of the Templeton Chicago MBAs longitudinal study. University of Chicago, 1–49.
Ritchie, S. J., Bates, T. C., & Deary, I. J. (2015). Is education associated with improvements in general cognitive ability, or in specific skills? Developmental Psychology, 51(5), 573–582.
Rizzolli, M., & Tremewan, J. (2016). Hard Labour in the LAB: Are monetary and non-monetary sanctions really substitutable? Department of Economics University of Vienna.
Roid, G. H. (2003). Stanford-Binet intelligence scales. Riverside Pub.
Roth, P. L., Le, H., Oh, I.-S., Van Iddekinge, C. H., & Bobko, P. (2018). Using beta coefficients to impute missing correlations in meta-analysis research: Reasons for caution. Journal of Applied Psychology, 103(6), 644–658. https://doi.org/10.1037/apl0000293.
Rothstein, H. R., Sutton, A. J., & Borenstein, M. (2006). Publication bias in meta-analysis: Prevention, assessment and adjustments.The Atrium, Southern Gate, Chichester, West Sussex PO19 8SQ, England: John Wiley & Sons Ltd.
Rydval, O. (2012). The causal effect of cognitive abilities on economic behavior: evidence from a forecasting task with varying cognitive load. SSRN Electronic Journal. http://dx.doi.org/10.2139/ssrn.2046942.
Sabater-Grande, G., & Georgantzis, N. (2002). Accounting for risk aversion in repeated prisoners’ dilemma games: An experimental test. Journal of Economic Behavior & Organization, 48(1), 37–50.
Sartarelli, M. (2016). Handedness, ability, earnings and risk. Evidence from the Lab. Instituto Valenciano de Investigaciones Económicas, SA (Ivie).
Schleich, J., Gassmann, X., Meissner, T., & Faure, C. (2018). A large-scale test of the effects of time discounting, risk aversion, loss aversion, and present bias on household adoption of energy-efficient technologies. Working Paper Sustainability and Innovation.
Schneeweis, N., Skirbekk, V., & Winter-Ebmer, R. (2014). Does education improve cognitive performance four decades after school completion? Demography, 51(2), 619–643.
Seijts, G., & Crim, D. (2009). The combined effects of goal type and cognitive ability on performance. Motivation and Emotion, 33(4), 343–352.
Sepúlveda, M., Fernández-Diez, B., Martínez-Lapiscina, E. H., Llufriu, S., Sola-Valls, N., Zubizarreta, I., … Glimcher, P. (2017). Impairment of decision-making in multiple sclerosis: A neuroeconomic approach. Multiple Sclerosis Journal, 23(13), 1762–1771.
Shamosh, N. A., & Gray, J. R. (2008). Delay discounting and intelligence: A meta-analysis. Intelligence, 36(4), 289–305. https://doi.org/10.1016/j.intell.2007.09.004.
Sharma, S., Bottom, W. P., & Elfenbein, H. A. (2013). On the role of personality, cognitive ability, and emotional intelligence in predicting negotiation outcomes. Organizational Psychology Review, 3(4), 293–336. https://doi.org/10.1177/2041386613505857.
Sheremeta, R. M. (2018). Impulsive behavior in competition: Testing theories of overbidding in rent-seeking contests. SSRN Electronic Journal. http://dx.doi.org/10.2139/ssrn.2676419.
Sousa, S. A., & Rangel, M. de A. (2014). Do as i do, not as i say: Incentivization and the relationship between cognitive ability and riskaversion. Working paper.
Spearman, C. (1904a). “ General intelligence,” objectively determined and measured. The American Journal of Psychology, 15(2), 201–292.
Spearman, C. (1904b). The proof and measurement of association between two things. American Journal of Psychology, 15(1), 72–101.
Staněk, R., & Krčál, O. (2018). Time preferences, cognitive abilities and intrinsic motivation to exert effort. Applied Economics Letters, 1033–1037.
Stango, V., Yoong, J., & Zinman, J. (2017). The quest for parsimony in behavioral economics: New methods and evidence on three fronts. National Bureau of Economic Research.
Stanovich, K. E. (2010). Rationality and the reflective mind. Oxford University Press. https://doi.org/10.1093/acprof:oso/9780195341140.001.0001.
Stanovich, K. E., & West, R. F. (1998). Individual differences in rational thought. Journal of Experimental Psychology: General, 127(2), 161–188.
Steel, P. D., & Kammeyer-Mueller, J. D. (2002). Comparing meta-analytic moderator estimation techniques under realistic conditions. Journal of Applied Psychology, 87(1), 96–111.
Sternberg, R. J. (1985). Beyond IQ: A triarchic theory of human intelligence. Cambridge, England: Cambridge University Press.
Stewart, C. C., Yu, L., Wilson, R. S., Bennett, D. A., & Boyle, P. A. (2018). Correlates of healthcare and financial decision making among older adults without dementia. Health Psychology, 37(7), 618–626.
Strand, S., Deary, I. J., & Smith, P. (2006). Sex differences in Cognitive Abilities Test scores: A UK national picture. British Journal of Educational Psychology, 76(3), 463–480. https://doi.org/10.1348/000709905X50906.
Strauss, J., Witoelar, F., & Sikoki, B. (2016). The fifth wave of the Indonesia family life survey: overview and field report. RAND.
Süß, H.-M., Oberauer, K., Wittmann, W. W., Wilhelm, O., & Schulze, R. (2002). Working-memory capacity explains reasoning ability—and a little bit more. Intelligence, 30(3), 261–288.
Suzuki, A., Mano, Y., & Abebe, G. (2018). Earnings, savings, and job satisfaction in a labor-intensive export sector: Evidence from the cut flower industry in Ethiopia. World Development, 110, 176–191.
Swinscow, T. D. V., & Campbell, M. J. (2002). Statistics at square one. London: BMJ Publishing Group.
Sytsma, T. (2014). Handling risk: Testosterone and risk preference, evidence from Dhaka, Bangladesh.Master’s Theses. 85. https://repository.usfca.edu/thes/85.
Taylor, M. P. (2013). Bias and brains: Risk aversion and cognitive ability across real and hypothetical settings. Journal of Risk and Uncertainty, 46(3), 299–320. https://doi.org/10.1007/s11166-013-9166-8.
Taylor, M. P. (2016). Are high-ability individuals really more tolerant of risk? A test of the relationship between risk aversion and cognitive ability. Journal of Behavioral and Experimental Economics, 63, 136–147. https://doi.org/10.1016/j.socec.2016.06.001.
Thaler, R. H., Tversky, A., Kahneman, D., & Schwartz, A. (1997). The effect of myopia and loss aversion on risk taking: An experimental test. The Quarterly Journal of Economics, 112(2), 647–661.
Thompson, S. G., & Higgins, J. P. T. (2002). How should meta-regression analyses be undertaken and interpreted? Statistics in Medicine, 21(11), 1559–1573.
Toplak, M. E., West, R. F., & Stanovich, K. E. (2011). The Cognitive Reflection Test as a predictor of performance on heuristics-and-biases tasks. Memory & Cognition, 39(7), 1275–1289. https://doi.org/10.3758/s13421-011-0104-1.
Toubia, O., Johnson, E., Evgeniou, T., & Delquié, P. (2013). Dynamic experiments for estimating preferences: An adaptive method of eliciting time and risk parameters. Management Science, 59(3), 613–640.
Tymula, A., Belmaker, L. A. R., Roy, A. K., Ruderman, L., Manson, K., Glimcher, P. W., & Levy, I. (2012). Adolescents’ risk-taking behavior is driven by tolerance to ambiguity. Proceedings of the National Academy of Sciences, 109(42), 17135–17140.
Tymula, A., Belmaker, L. A. R., Ruderman, L., Glimcher, P. W., & Levy, I. (2013). Like cognitive function, decision making across the life span shows profound age-related changes. Proceedings of the National Academy of Sciences, 110(42), 17143–17148.
van der Heijden, E., Klein, T. J., Müller, W., & Potters, J. (2012). Framing effects and impatience: Evidence from a large scale experiment. Journal of Economic Behavior & Organization, 84(2), 701–711.
van der Leer, L., Hartig, B., Goldmanis, M., & McKay, R. (2015). Delusion proneness and ‘jumping to conclusions’: relative and absolute effects. Psychological Medicine, 45(6), 1253–1262.
Van Rooij, M., Lusardi, A., & Alessie, R. (2011). Financial literacy and stock market participation. Journal of Financial Economics, 101(2), 449–472.
Viechtbauer, W. (2005). Bias and efficiency of meta-analytic variance estimators in the random-effects model. Journal of Educational and Behavioral Statistics, 30(3), 261–293.
Viechtbauer, W. (2010). Conducting meta-analyses in R with the metafor package. J Stat Softw, 36(3), 1–48.
Viechtbauer, W., & Cheung, M. W.-L. (2010). Outlier and influence diagnostics for meta-analysis. Research Synthesis Methods, 1(2), 112–125. https://doi.org/10.1002/jrsm.11.
Wechsler, D. (2008). Wechsler Adult Intelligence Scale – fourth edition (WAIS–IV). San Antonio, Texas: Psychological Corporation.
Weisser, R. A. (2014). How ‘real’ is ‘hypothetical bias’ in the context of risk and time preference elicitation. Working paper
Weller, J. A., Dieckmann, N. F., Tusler, M., Mertz, C. K., Burns, W. J., & Peters, E. (2013). Development and testing of an abbreviated numeracy scale: A Rasch analysis approach. Journal of Behavioral Decision Making, 26(2), 198–212.
Wickham, H., François, R., Henry, L., & Müller, K. (2018). dplyr: A grammar of data manipulation. Retrieved from https://cran.r-project.org/package=dplyr.
Yeo, G. B., & Neal, A. (2004). A multilevel analysis of effort, practice, and performance: Effects; of ability, conscientiousness, and goal orientation. Journal of Applied Psychology, 89(2), 231–247. https://doi.org/10.1037/0021-9010.89.2.231.
Ziegelmeyer, F., & Ziegelmeyer, M. (2016). Parenting is risky business: parental risk attitudes in small stakes decisions on behalf of their children. Review of Economics of the Household, 14(3), 599–623.
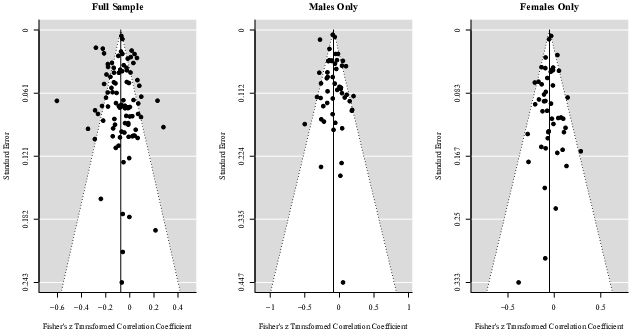
Figure 5: Funnel plots for the domain of gains — full sample, males and females only.
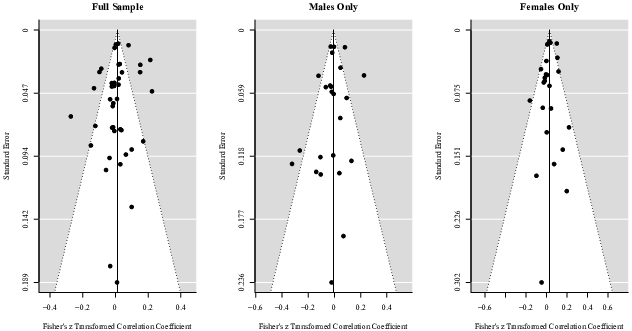
Figure 6: Funnel plots for the mixed domain — full sample, males and females only.
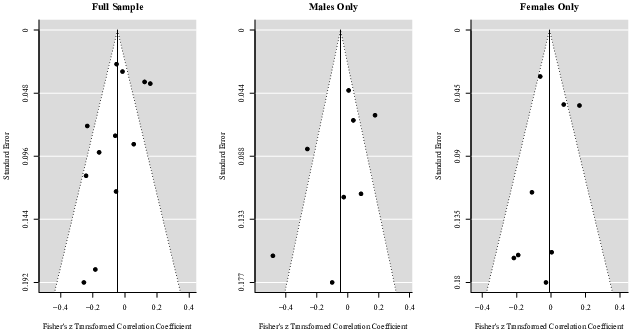
Figure 7: Funnel plots for the domain of losses — full sample, males and females only.
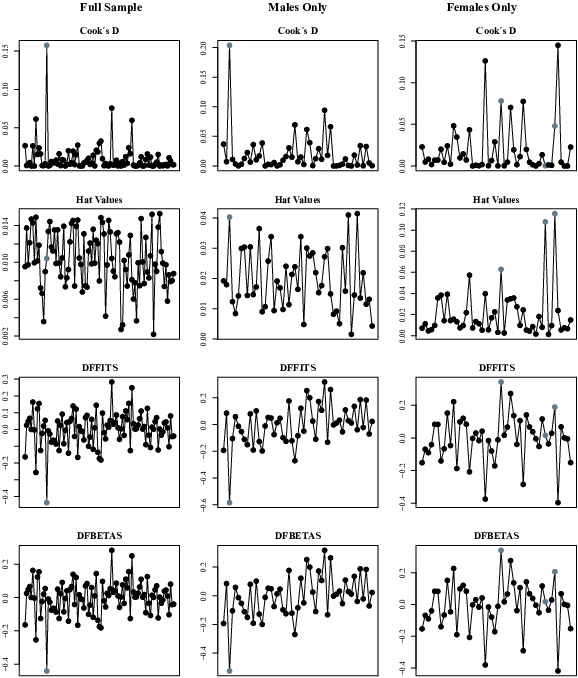
Figure 8: Case deletion diagnostics for the domain of gains. (All studies identified as influential are marked with gray)
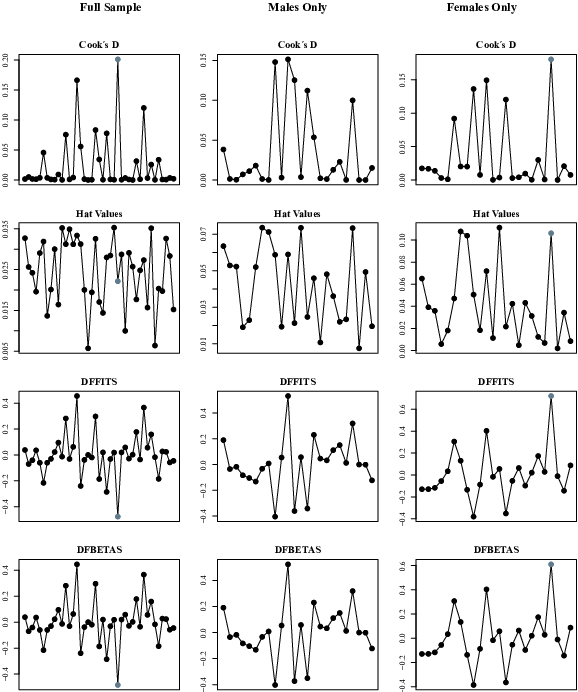
Figure 9: Case deletion diagnostics for the mixed domain. (All studies identified as influential are marked with gray)
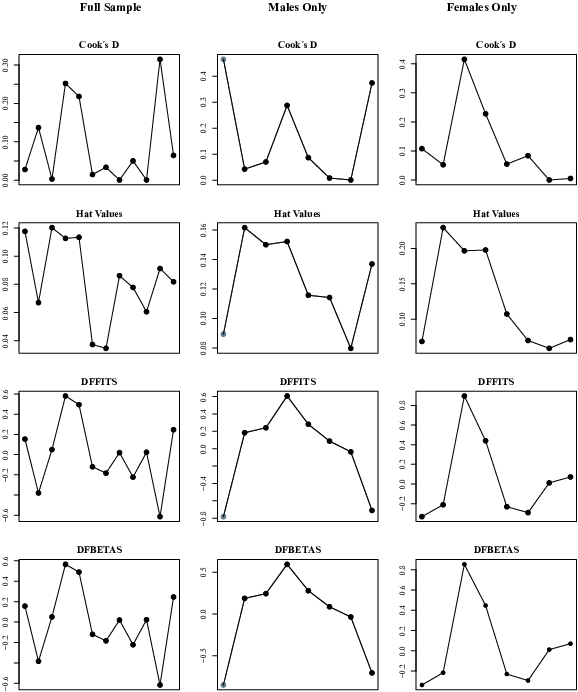
Figure 10: Case deletion diagnostics for the domain of losses. (All studies identified as influential are marked with gray)
Table 1: Overview of studies included in the domain of gains.
Author Year N Male Female MF-Ratio Payment CAM Probabilities Al-Ubaydli et al 2013 171 115 56 2.054 Yes RPM Changes Albaity et al 2014 880 367 513 0.715 NA CRT Constant(0.75) Alexy et al 2016 181 65 116 0.560 NA CRT Changes Alonso et al 2018 389 NA NA NA Yes CRT NA Andersson et al Study 1 2016 2333 1213 1120 1.083 Yes CATB Constant(0.50) Andersson et al Study 2 2016 1396 740 656 1.128 Yes CATB Constant(0.50) Basteck & Mantovani 2018 192 102 90 1.133 Yes RPM NA Beauchamp et al 2017 3482 3482 0 NA NA CATB Changes Ben-Ner & Halldorsson 2010 204 65 139 0.468 Yes CATB Constant(0.50) Bendahan et al 2017 352 210 142 1.479 Yes RPM Changes Benjamin et al study1 2013 94 58 36 1.611 Yes NUM Constant(0.50) Benjamin et al study 2 2013 81 36 45 0.800 Yes NUM Constant(0.50) Benjamin et al study 3 2013 34 NA NA NA Yes NUM Constant(0.50) Blankenstein et al 2016 148 71 77 0.922 Yes RPM Changes Booth et al 2014 219 144 75 1.920 Yes RPM Constant(0.50) Booth et al 2016 693 334 359 0.930 Yes RPM Constant(0.50) Borghans & Golsteyn 2007 1631 NA NA NA NA CRT Constant(0.50) Borghans et al 2009 327 169 158 1.070 Yes RPM Constant(0.50) Bosch-Rosa et al 2018 283 NA NA NA Yes CRT Changes Bradford et al 2017 762 352 398 0.884 Yes CRT Changes Branas-Garza & Rustichini 2011 188 72 116 0.621 NA RPM Changes Branas-Garza et al 2014 766 355 411 0.864 Yes NUM Changes Branas-Garza et al 2012 191 74 117 0.632 Yes CATB Changes Breaban & Noussair 2015 128 NA NA NA Yes CRT Changes Bruttel & Fischbacher 2013 224 95 129 0.736 Yes CRT Changes Burks et al 2009 1009 902 107 8.430 Yes CATB Constant(0.50) Burks et al 2015 97 39 58 0.672 Yes CATB Constant(0.50) Cabrales et al 2017 124 48 76 0.632 Yes CRT Changes Campitelli & Labollita 2010 157 47 110 0.427 NA CRT Changes Campos-Vazquez et al 2018 404 214 190 1.126 Yes RPM Constant(0.50) Carpena et al 2017 1328 562 766 0.734 Yes NUM Constant(0.50) Castillo 2017 1882 NA NA NA Yes CATB Constant(0.50) Cavatorta & Schroder 2018 99 41 58 0.707 Yes RPM Changes Chapman et al (a) 2018 1000 NA NA NA Yes CATB Constant(0.50) Chapman et al (b) 2018 2000 NA NA NA Yes CATB Constant(0.50) Charness et al 2018 223 114 109 1.046 Yes RPM Constant(0.66) Chen et al 2017 183 92 91 1.011 Yes CRT Changes Chen et al 2014 84 43 41 1.049 NA CATB Changes Choi et al 2018 600 181 419 0.432 Yes RPM Constant Corgnet et al 2016 100 53 47 1.128 Yes CRT Changes Csermely & Rabas 2016 96 52 44 1.182 Yes CRT Constant(0.50) Cueva et al 2015 281 140 141 0.993 Yes CATB Constant(0.50) Cueva et al study 1 2016 384 NA NA NA Yes CRT Changes Cueva et al study 2 2016 186 NA NA NA Yes CRT Constant(0.50) Dave et al 2010 801 347 454 0.764 Yes NUM Changes Dean & Ortoleva 2012 190 NA NA NA Yes RPM Constant(0.50) Deckers et al 2017 435 NA NA NA Yes CATB Constant(0.50) Dohmen et al 2010 376 178 198 0.899 Yes CATB Constant(0.50) Duttle & Inukai 2015 114 88 26 3.385 Yes CRT Changes Note. Not available (NA), cognitive ability measure (CAM), student sample (S), community sample (CS), children sample (CHS), cognitive ability test battery (CATB), ravens progressive matrices (RPM), cognitive reflection task (CRT), numeracy test (NUM), working memory capacity test (WMC), adaptive lottery task (ALT), bomb elicitation risk task (BRET), cups task (CT), decision task battery (DTB), Eckel-Grossman risk task (EGRT), Ellsberg urn risk task (EURT), gift gamble task (GGT), income gamble task (IGT), lottery task (LT), multiple price list (MPL), one-shot gambling task (OGT), Sabater-Grande-Georgantzis lottery panel (SGG), wheel of fortune task (WTF).
Table 1, continued.
Author Year N Male Female MF-Ratio Payment CAM Probabilities Frederick 2005 3150 NA NA NA Yes CRT Changes Frey et al 2017 1480 561 919 0.610 Yes CATB Changes Gaurav et al 2011 597 525 72 7.292 Yes NUM Constant(0.50) Gerhardt et al 2011 41 20 21 0.952 Yes CRT Changes Guillen et al 2014 180 NA NA NA Yes CATB NA Gupta et al 2013 1904 1010 894 1.130 NA NUM Constant(0.50) Hefti et al 2016 672 339 333 1.018 Yes RPM Constant(0.50) Ibanez et al 2016 220 82 138 0.594 Yes CATB Changes Johnson & Pevnitskaya 2013 150 77 73 1.055 Yes RPM Changes Kable et al 2017 128 71 57 1.246 NA CATB Changes Kirchler et al 2017 603 254 349 0.728 Yes CRT Constant(0.50) Koch & Nafziger 2016 643 284 359 0.791 Yes CRT Constant(0.50) Kocher et al 2014 400 148 252 0.587 Yes CRT Constant(0.50) Kurnianingsih 2015 25 11 14 0.786 Yes CATB Changes Levin & Hart 2003 30 11 19 0.579 Yes CATB Constant(0.50) Lezzi et al 2015 206 95 111 0.856 Yes NUM Changes Mather et al 2012 157 79 78 1.013 Yes CATB Changes Menapace et al 2015 99 99 0 NA Yes NUM Constant(0.50) Mollerstrom & Seim 2014 247 247 0 NA NA CATB Constant(0.50) Oechssler et al 2009 551 333 218 1.528 Yes CRT Constant(0.75) Pachur et al 2017 118 76 42 1.810 Yes CATB Changes Park & Cho 2018 69 35 34 1.029 NA CATB Changes Peters & Bjalkebring 2015 108 40 68 0.588 Yes CATB Constant(0.50) Pollak et al 2016 35 21 14 1.500 NA CATB Changes Ponti et al 2014 192 NA NA NA Yes CRT Changes Proto et al 2014 100 38 62 0.613 Yes RPM Changes Ramlall 2014 2565 1359 1206 1.127 NA NUM Constant(0.50) Rangel & Sousa Study 1 2014 197 118 79 1.494 Yes CATB Constant Rangel & Sousa Study 2 2014 106 50 56 0.893 Yes CATB Constant Reuben et al 2008 498 345 153 2.255 Yes CRT Constant(0.50) Rizzolli & Tremewan 2016 146 83 63 1.317 Yes CRT Constant(0.50) Rydval 2012 124 58 66 0.879 Yes WMC NA Sartarelli 2016 240 129 111 1.162 Yes CRT Constant(0.50) Schleich et al 2018 13436 6718 6718 1.000 Yes CRT Constant(0.50) Sepulveda et al 2017 20 8 12 0.667 Yes CATB Constant(0.50) Sheremeta 2018 184 NA NA NA Yes CATB Constant(0.50) Stanek & Krcal 2018 149 73 76 0.961 Yes CATB NA Stewart et al 2018 937 221 716 0.309 NA CATB Constant(0.50) Strauss et al 2016 31201 14624 16577 0.882 NA CATB Constant(0.50) Suzuki et al 2018 277 66 211 0.313 NA NUM Constant(0.50) Sytsma et al 2014 190 147 43 3.419 Yes RPM Constant Taylor 2013 98 59 39 1.513 Yes CATB Changes Taylor 2016 181 89 92 0.967 Yes CRT Changes Tymula et al 2012 65 31 34 0.912 Yes CATB Changes Tymula et al 2013 135 70 65 1.077 Yes CATB Changes van der Leer et al 2015 112 53 59 0.898 Yes RPM Changes Weisser 2014 115 63 52 1.212 Yes CRT Constant(0.50) Ziegelmeyer & Ziegelmeyer 2016 140 18 122 0.148 Yes CRT Changes
Table 1, continued.
Author Year Incentivized R-Recode R-Male-Recode Al-Ubaydli et al 2013 Random −.280 −.260 Albaity et al 2014 NA −.050 NA Alexy et al 2016 No −.012 NA Alonso et al 2018 Random −.007 NA Andersson et al Study 1 2016 Random −.072 NA Andersson et al Study 2 2016 Random .059 NA Basteck & Mantovani 2018 Yes −.076 .000 Beauchamp et al 2017 No −.274 −.274 Ben-Ner & Halldorsson 2010 Random .070 NA Bendahan et al 2017 Yes .079 NA Benjamin et al study1 2013 Yes −.282 −.230 Benjamin et al study 2 2013 Yes −.116 .039 Benjamin et al study 3 2013 Yes −.003 NA Blankenstein et al 2016 Random .000 −.096 Booth et al 2014 Random −.540 NA Booth et al 2016 Random −.080 −.111 Borghans & Golsteyn 2007 No −.095 NA Borghans et al 2009 Yes −.151 NA Bosch-Rosa et al 2018 NA −.142 NA Bradford et al 2017 Random −.132 −.145 Branas-Garza & Rustichini 2011 No −.179 −.266 Branas-Garza et al 2014 No −.027 −.036 Branas-Garza et al 2012 NA −.226 −.313 Breaban & Noussair 2015 Random −.039 NA Bruttel & Fischbacher 2013 Random .031 .020 Burks et al 2009 Random −.147 −.143 Burks et al 2015 Yes −.081 −.463 Cabrales et al 2017 Yes −.013 −.098 Campitelli & Labollita 2010 NA −.258 NA Campos-Vazquez et al 2018 Yes −.025 −.045 Carpena et al 2017 NA −.017 −.055 Castillo 2017 Yes .040 NA Cavatorta & Schroder 2018 Yes −.140 −.221 Chapman et al (a) 2018 Yes .030 NA Chapman et al (b) 2018 Yes −.210 NA Charness et al 2018 Random −.053 −.068 Chen et al 2017 Random −.083 −.033 Chen et al 2014 NA −.093 −.257 Choi et al 2018 Yes −.130 −.173 Corgnet et al 2016 Random .040 NA Csermely & Rabas 2016 Random .065 .177 Cueva et al 2015 Random −.181 −.181 Cueva et al study 1 2016 Random −.118 NA Cueva et al study 2 2016 Random .001 NA Dave et al 2010 Random −.178 NA Dean & Ortoleva 2012 Random −.060 NA Deckers et al 2017 Yes .063 NA Dohmen et al 2010 Random −.210 −.283 Duttle & Inukai 2015 Random −.333 −.170
Table 1, continued.
Author Year Incentivized R-Recode R-Male-Recode Frederick 2005 No −.220 NA Frey et al 2017 Random .008 −.020 Gaurav et al 2011 Yes −.090 NA Gerhardt et al 2011 Random −.235 −.260 Guillen et al 2014 Yes −.040 NA Gupta et al 2013 No −.061 NA Hefti et al 2016 Random −.024 .050 Ibanez et al 2016 Random .226 NA Johnson & Pevnitskaya 2013 Yes −.030 NA Kable et al 2017 NA −.013 NA Kirchler et al 2017 Random .006 .037 Koch & Nafziger 2016 Random −.063 −.065 Kocher et al 2014 Random −.131 −.169 Kurnianingsih 2015 Random −.058 NA Levin & Hart 2003 Yes .210 NA Lezzi et al 2015 Random −.114 NA Mather et al 2012 Random .069 .105 Menapace et al 2015 NA .022 .022 Mollerstrom & Seim 2014 No .095 .095 Oechssler et al 2009 Random −.191 −.159 Pachur et al 2017 Random .272 .201 Park & Cho 2018 NA −.005 −.085 Peters & Bjalkebring 2015 No −.068 −.060 Pollak et al 2016 No −.058 .031 Ponti et al 2014 Random −.040 NA Proto et al 2014 Random .030 NA Ramlall 2014 NA .015 NA Rangel & Sousa Study 1 2014 Yes −.069 NA Rangel & Sousa Study 2 2014 Random −.045 NA Reuben et al 2008 Random −.159 −.112 Rizzolli & Tremewan 2016 Random .093 .036 Rydval 2012 No −.122 NA Sartarelli 2016 Random −.194 NA Schleich et al 2018 Random −.061 −.068 Sepulveda et al 2017 Yes −.066 .052 Sheremeta 2018 Random −.015 NA Stanek & Krcal 2018 Yes .021 .076 Stewart et al 2018 No −.180 NA Strauss et al 2016 No −.070 −.097 Suzuki et al 2018 NA −.109 .147 Sytsma et al 2014 NA −.090 −.097 Taylor 2013 Random −.010 NA Taylor 2016 Random −.017 NA Tymula et al 2012 Random −.052 NA Tymula et al 2013 Random −.217 NA van der Leer et al 2015 NA .049 .182 Weisser 2014 No −.137 −.175 Ziegelmeyer & Ziegelmeyer 2016 Yes −.127 .014
Table 2: Moderator analysis for the domain of gains.
Moderator K β SE 95% CI Test of Moderators Test of Residual Heterogeneity MF-Ratio Intercept 78 −.06** .02 [−.10, −.02] QM (df = 1) = 1.74 QE (df = 76) = 287.08*** MF-Ratio −.01 .01 [−.03, .01] Age Intercept 66 −.06 .04 [−.14, .02] QM (df = 1) = 0.12 QE (df = 64) = 255.19*** Avrg. age −.00 .00 [−.00, .00] Sample Type Intercept (CHS) 96 .02 .06 [−.09, .13] QM (df = 2) = 3.22 QE (df = 93) = 570.21*** CS −.10 .06 [−.21, .02] S −.10 .06 [−.22, .01] Avrg. Payment Intercept 34 −.06* .03 [−.11, −.01] QM (df = 1) = 0.70 QE (df = 32) = 177.51*** Avrg. payment −.00 .00 [−.00, .00] CAM Intercept (CATB) 97 −.05* .02 [−.09, −.01] QM (df = 4) = 3.20 QE (df = 92) = 599.10*** CRT −.04 .03 [−.10, .02] NUM −.03 .04 [−.11, .05] RPM −.05 .04 [−.12, .02] WMC −.08 .14 [−.34, .19] Decision Task Intercept (ALT) 97 −.21* .10 [−.41, −.02] QM (df = 12) = 14.73 QE (df = 84) = 419.39*** BRET .18 .12 [−.06, .42] CT .12 .18 [−.23, .47] DTB .08 .11 [−.14, .29] EGRT .19 .11 [−.03, .41] EURT .06 .15 [−.23, .35] GGT .43 .24 [−.04, .89] IGT .14 .14 [−.13, .42] LT .13 .10 [−.07, .33] MPL .13 .10 [−.06, .33] OGT .17 .11 [−.04, .38] SGG .44** .15 [.14, .75] WFT .21 .16 [−.10, .53] Certain Option Intercept (No) 97 −.05 .02 [−09, .00] QM (df = 2) = 2.19 QE (df = 94) = 589.20*** Yes −.04 .03 [−.10, .01] Yes/No −.03 .05 [−.12, .07] Probabilities Intercept (Changes) 92 −.08*** .02 [−.12, −.04] QM (df = 4) = 0.42 QE (df = 87) = 530.28*** Constant −.01 .07 [−.14, .12] Constant (50%) .00 .03 [−.05, .06] Constant (66%) .02 .13 [−.22, .27] Constant (75%) −.04 .08 [−.20, .12] Payoff Safer Choice Intercept (Changes) 94 −.09*** .02 [−.13, −.06] QM (df = 1) = 2.07 QE (df = 92) = 539.77*** Constant .04 .02 [−.01, .08] Payoff Riskier Choice Intercept (Changes) 94 −.08*** .02 [−.12, −.04] QM (df = 1) = 0.13 QE (df = 92) = 603.39*** Constant .01 .03 [−.04, .06] Incentivized Intercept (No) 84 −.11*** .03 [−.17, −.05] QM (df = 2) = 1.62 QE (df = 81) = 543.61*** Random .04 .04 [−.03, .11] Yes .05 .04 [−.03, .13] Risk Averse Choices Intercept 76 −.04 .06 [−.15, .07] QM (df = 1) = 0.39 QE (df = 74) = 512.13*** Risk Averse Choices % −.00 .00 [−.00, .00] Primary purpose Intercept (No) 97 −.07*** .01 [−.10, −.04] QM (df = 1) = 0.18 QE (df = 95) = 602.08*** Yes −.01 .03 [−.07, .04] Beta Imputed Intercept (No) 97 −.07*** .01 [−.10, −.04] QM (df = 1) = 0.68 QE (df = 95) = 553.28*** Yes −.03 .03 [−.09, .03] Note. p < .05 = *, p < .01 = **, p < .001 = ***.
Table 3: Moderator analysis for the domain of gains — males only.
Moderator K β SE 95% CI Test of Moderators Test of Residual Heterogeneity Sample Type Intercept (CHS) 50 .03 .25 [−.46, .53] QM (df = 2) = 0.54 QE (df = 47) = 207.70*** CS −.11 .25 [−.61, .39] S −.13 .25 [−.63, .37] Avrg. Payment Intercept 17 −.07 .04 [−.15, .01] QM (df = 1) = 0.01 QE (df = 15) = 26.94* Avrg. payment .00 .00 [−.00, .00] CAM Intercept (CATB) 51 −.11*** .03 [−.17, −.05] QM (df = 3) = 2.00 QE (df = 47) = 184.89*** CRT .03 .04 [−.05, .12] NUM .09 .06 [−.04, .21] RPM .02 .05 [−.07, .12] Decision Task Intercept (ALT) 51 −.10 .15 [−.39, .20] QM (df = 8) = 7.46 QE (df = 42) = 107.15*** BRET .13 .18 [−.22, .48] CT −.17 .23 [−.63, .29] DTB −.08 .16 [−.40, .23] EGRT .05 .17 [−.29, .39] IGT −.00 .17 [−.34, .34] LT .07 .15 [−.23, .37] MPL .00 .15 [−.30, .30] OGT −.01 .17 [−.33, .32] Certain Option Intercept (No) 51 −.04 .04 [−.11, .03] QM (df = 2) = 2.40 QE (df = 48) = 189.04*** Yes −.06 .04 [−.15, .02] Yes/No −.03 .07 [−.17, .12] Probabilities Intercept (Changes) 49 −.11*** .03 [−.17, −.04] QM (df = 4) = 1.55 QE (df = 44) = 144.95*** Constant −.03 .09 [−.21, .15] Constant (50%) .03 .04 [−.04, 0.11] Constant (66%) .04 .14 [−.23, .30] Constant (75%) −.05 .11 [−.27, .16] Payoff Safer Choice Intercept (Changes) 49 −.09*** .02 [−.14, −.05] QM (df = 1) = 0.05 QE (df = 47) = 174.32*** Constant .01 .04 [−.06, .08] Payoff Riskier Choice Intercept (Changes) 49 −.09** .03 [−.14, −.03] QM (df = 1) = 0.01 QE (df = 47) = 205.81*** Constant −.00 .04 [−.08, .07] Incentivized Intercept (No) 43 −.11** .04 [−.20, −.03] QM (df = 2) = 0.57 QE (df = 40) = 175.67*** Random .03 .05 [−.06, .13] Yes .01 .06 [−.12, .14] Risk Averse Choices % Intercept 45 −.05 .07 [−.19, .09] QM (df = 1) = 0.35 QE (df = 43) = 174.06*** Risk averse choices % −.00 .00 [−.00, .00] Primary purpose Intercept (No) 51 −.08*** .02 [−0.11, −.04] QM (df = 1) = 1.66 QE (df = 49) = 209.40*** Yes −.07 .05 [−.17, .03] Beta Imputed Intercept (No) 51 −.08*** .02 [−.12, −.05] QM (df = 1) = 0.40 QE (df = 49) = 119.74*** Yes −.04 .06 [−.16, .08] Note. p < .05 = *, p < .01 = **, p < .001 = ***.
Table 4: Moderator analysis for the domain of gains — females only.
Moderator K β SE 95% CI Test of Moderators Test of Residual Heterogeneity Sample Type Intercept (CHS) 47 −.10 .30 [−.69, .50] QM (df = 2) = 0.41 QE (df = 44) = 58.72 CS .04 .30 [−.56, .63] S .05 .30 [−.54, .65] Avrg. Payment Intercept 16 −.04 .04 [−.11, .03] QM (df = 1) = 0.14 QE (df = 14) = 20.26 Avrg. payment −.00 .00 [−.00, .00] CAM Intercept (CATB) 48 −.03 .02 [−.07, .01] QM (df = 3) = 3.80 QE (df = 44) = 52.09 CRT −.02 .03 [−.08, .04] NUM −.07 .04 [−.15, .00] RPM −.04 .03 [−.11, .03] Decision Task Intercept (ALT) 48 .04 .12 [−.19, .27] QM (df = 8) = 17.09* QE (df = 39) = 43.29 BRET −.12 .14 [−.40, .15] CT −.01 .20 [−.40, .38] DTB −.02 .12 [−.26, .21] EGRT .05 .20 [−.34, .43] IGT −.08 .12 [−.30, .15] LT −.05 .12 [−.28, .19] MPL −.10 .12 [−.33, .12] OGT −.15 .12 [−.39, .08] Certain Option Intercept (No) 48 −.04 .02 [−.08, .01] QM (df = 2) = 0.95 QE (df = 45) = 60.16 Yes −.03 .03 [−.08, .03] Yes/No −.01 .06 [−.13, .11] Probabilities Intercept (Changes) 46 −.02 .02 [−.06, .02] QM (df = 4) = 7.01 QE (df = 41) = 51.20 Constant −.10 .06 [−.21, .01] Constant (50%) −.04 .02 [−.09, .01] Constant (66%) −.02 .10 [−.22, .18] Constant (75%) −.15* .08 [−.30, −.01] Payoff Safer Choice Intercept (Changes) 46 −.05** .02 [−.08, −.01] QM (df = 1) = 0.07 QE (df = 44) = 59.72 Constant −.01 .03 [−.06, .04] Payoff Riskier Choice Intercept (Changes 46 −.03 .02 [−.06, .00] QM (df = 1) = 4.35* QE (df = 44) = 53.66 Constant −.05* .02 [−.09, −.00] Incentivized Intercept (No) 41 −.04 .03 [−.09, .01] QM (df = 2) = 1.86 QE (df = 38) = 46.26 Random −.01 .03 [−.06, .05] Yes −.05 .04 [−.13, .03] Risk Averse Choices % Intercept 43 −.07* .04 [−.15, −.00] QM (df = 1) = 0.28 QE (df = 41) = 46.96 Risk averse choices % .00 .00 [−.00, .00] Primary purpose Intercept (No) 48 −.05*** .01 [−.08, −.03] QM (df = 1) = 0.15 QE (df = 46) = 59.72 Yes −.02 .04 [−.09, .06] Beta Imputed Intercept (No) 48 −.05*** .01 [−.08, −.03] QM (df = 1) = 0.77 QE (df = 46) = 59.68 Yes .14 .16 [−.18, .46] Note. p < .05 = *, p < .01 = **, p < .001 = ***.
Table 5: Overview of studies included in the mixed domain.
Author Year N Male Female MF-Ratio Payment CAM Probabilities Alan et al 2014 1550 812 738 1.100 Yes RPM Constant(0.50) Alan et al study 1 2017 375 375 0 NA Yes CATB Constant(0.50) Alan et al study 2 2017 311 0 311 NA Yes CATB Constant(0.50) Alexy et al 2016 181 65 116 0.560 NA CRT Changes Angerer et al 2015 636 361 275 1.313 Yes RPM Constant(0.50) Bateman el al 2015 1199 NA NA NA Yes NUM Constant Benjamin et al Study 1 2013 94 58 36 1.611 Yes NUM Constant(0.50) Branas-Garza & Rustichini 2011 192 74 117 0.632 NA RPM Constant(0.50) Branas-Garza et al 2014 766 355 411 0.864 Yes NUM Constant(0.50) Breaban & Noussair 2015 128 NA NA NA Yes CRT Constant(0.50) NLSY79 1993 8548 4219 4329 0.975 NA CATB Constant(0.50) Burks et al 2009 1009 902 107 8.430 Yes CATB Constant(0.50) Campos-Vazquez et al 2018 5626 2240 3386 0.662 NA RPM Constant(0.50) Chapman et al (a) 2018 1000 NA NA NA Yes CATB Constant(0.50) Chapman et al (b) 2018 2000 NA NA NA Yes CATB Constant(0.50) Choi et al 2014 1014 552 462 1.195 Yes CRT Constant(0.50) Dean & Ortoleva 2012 190 NA NA NA Yes RPM Constant(0.50) Diaz & Forero 2013 31 31 0 NA NA RPM Changes Drichoutis 2017 178 59 119 0.496 Yes RPM Constant(0.50) Frey et al 2017 1479 560 919 0.609 Yes CATB Changes Goh et al 2016 137 67 70 0.957 NA CATB Changes Golman et al 2015 102 48 54 0.889 Yes NUM Constant(0.50) Grohman et al 2015 530 276 254 1.087 NA NUM Constant(0.50) He et al 2010 572 260 312 0.833 Yes CATB Constant(0.50) HRS 2014 9720 4116 5604 0.734 NA CATB Constant(0.50) Horn & Kiss 2018 242 82 144 0.569 Yes CRT Constant(0.50) Kirchler et al 2017 601 252 349 0.722 Yes CRT Constant(0.50) Kiss et al 2016 60 30 30 1.000 Yes CRT Constant(0.50) Koch & Nafziger 2016 643 284 359 0.791 Yes CRT Constant(0.50) Kocher et al 2018 379 151 228 0.662 Yes RPM Changes Kremer et al 2014 147 70 77 0.909 Yes CATB Constant(0.50) Li et al 2013 336 115 221 0.520 Yes CATB Constant(0.50) Li et al 2015 478 195 283 0.689 Yes CATB Changes Pachur et al 2017 118 76 42 1.810 Yes CATB Changes Platt & Parson 2017 7769 3885 3884 1.000 NA CATB Changes Pollak et al 2016 35 21 14 1.500 NA CATB Constant(0.50) Rangel & Sousa 2014 197 118 79 1.494 Yes CATB Constant(0.50) Sheremeta 2018 184 NA NA NA Yes CATB Constant(0.50) Stango et al 2017 1505 NA NA NA Yes CATB Constant(0.50) van der Heijden et al 2012 562 304 258 1.178 Yes CRT Constant(0.33) Weisser 2014 112 60 52 1.154 Yes CRT Constant(0.50) Note. Not available (NA), cognitive ability measure (CAM), student sample (S), community sample (CS), children sample (CHS), cognitive ability test battery (CATB), ravens progressive matrices (RPM), cognitive reflection task (CRT), numeracy test (NUM), adaptive lottery task (ALT), budget line allocation task (BLAT), Cambridge gamble task (CGT), decision task battery (DTB), Eckel-Grossman risk task (EGRT), Gneezy Potters investment task (GPIT), income gamble task (IGT), lottery task (LT), multiple price list (MPL), one-shot gambling task (OGT), portfolio choice task (PCT), Sabater-Grande-Georgantzis lottery panel (SGG).
Table 5, continued
Author Year Incentivized R-Recode R-Male-Recode R-Female-Recode Alan et al 2014 Yes .027 .046 −.001 Alan et al study 1 2017 Yes −.032 −.032 NA Alan et al study 2 2017 Yes −.017 NA −.017 Alexy et al 2016 No .037 NA NA Angerer et al 2015 Yes −.022 −.026 −.017 Bateman el al 2015 No −.086 NA NA Benjamin et al Study 1 2013 Yes −.057 −.104 −.098 Branas-Garza & Rustichini 2011 No −.014 −.106 .045 Branas-Garza et al 2014 No .020 −.065 .117 Breaban & Noussair 2015 Random .099 NA NA NLSY79 1993 No .003 −.028 .038 Burks et al 2009 Random .150 NA NA Campos-Vazquez et al 2018 NA −.005 −.017 .007 Chapman et al (a) 2018 Yes .040 NA NA Chapman et al (b) 2018 Yes .210 NA NA Choi et al 2014 Random −.097 −.121 −.054 Dean & Ortoleva 2012 Random −.020 NA NA Diaz & Forero 2013 Yes .010 NA NA Drichoutis 2017 Yes −.007 .038 −.037 Frey et al 2017 Random .151 .222 .106 Goh et al 2016 NA −.149 −.312 .002 Golman et al 2015 Random .030 NA NA Grohman et al 2015 NA −.130 NA NA He et al 2010 Random −.008 NA NA HRS 2014 No .017 −.003 .028 Horn & Kiss 2018 Random −.266 −.258 −.161 Kirchler et al 2017 Random .019 .093 .006 Kiss et al 2016 Random .099 .069 .195 Koch & Nafziger 2016 Random −.006 −.006 −.005 Kocher et al 2018 Random .010 .045 .029 Kremer et al 2014 Yes .168 .129 .216 Li et al 2013 No −.013 NA NA Li et al 2015 NA .220 NA NA Pachur et al 2017 Random .064 −.009 .074 Platt & Parson 2017 NA .080 .080 .100 Pollak et al 2016 No −.032 −.021 −.048 Rangel & Sousa 2014 No −.122 NA NA Sheremeta 2018 Random .030 NA NA Stango et al 2017 No .020 NA NA van der Heijden et al 2012 Yes −.022 −.020 −.027 Weisser 2014 No −.036 −.138 .157 Note. Not available (NA), cognitive ability measure (CAM), student sample (S), community sample (CS), children sample (CHS), cognitive ability test battery (CATB), ravens progressive matrices (RPM), cognitive reflection task (CRT), numeracy test (NUM), adaptive lottery task (ALT), budget line allocation task (BLAT), Cambridge gamble task (CGT), decision task battery (DTB), Eckel-Grossman risk task (EGRT), Gneezy Potters investment task (GPIT), income gamble task (IGT), lottery task (LT), multiple price list (MPL), one-shot gambling task (OGT), portfolio choice task (PCT), Sabater-Grande-Georgantzis lottery panel (SGG).
Table 6: Moderator analysis for the mixed domain.
Moderator K β SE 95% CI Test of Moderators Test of Residual Heterogeneity MF-Ratio Intercept 31 −.01 .02 [−.06, .03] QM (df = 1) = 2.21 QE (df = 29) = 144.63*** MF-Ratio .02 .01 [−.01, .04] Age Intercept 27 .04 .04 [−.05, .12] QM (df = 1) = 0.30 QE (df = 25) = 125.88*** Avrg. age −.00 .00 [−.00, .00] Sample Type Intercept (CHS) 41 .01 .04 [−.07, .09] QM (df = 2) = 2.13 QE (df = 38) = 228.29*** CS .02 .05 [−.07, .11] S −.03 .05 [−.12, .07] AvrgṖayment Intercept 10 −.00 .06 [−.12, .12] QM (df = 1) = 1.49 QE (df = 8) = 92.71*** Avrg. payment .00 .00 [−.00, .01] CAM Intercept (CATB) 41 .05** .02 [.02, .09] QM (df = 3) = 9.33* QE (df = 37) = 186.56*** CRT −.09* .04 [−.16, −.01] NUM −.11* .05 [−.20, −.02] RPM −.06 .04 [−.13, .02] Decision Task Intercept (ALT) 41 .22*** .04 [.14, .29] QM (df = 11) = 53.13 *** QE (df = 29) = 54.88** BLAT −.29*** .06 [−.41, −.17] CGT −.14* .06 [−.25, −.02] DTB −.06 .06 [−.19, .06] EGRT −.34*** .09 [−.52, −.16] GPIT −.24*** .04 [−.33, −.16] IGT −.21*** .05 [−.30, −.11] LT −.22*** .05 [−.31, −.13] MPL −.17*** .05 [−.26, −.09] OGT −.21*** .06 [−.33, −.09] PCT −.30*** .06 [−.43, −.18] SGG −.18 .09 [−.37, .01] Certain Option Intercept (No) 40 .08* .04 [.00, .17] QM (df = 1) = 3.63 QE (df = 38) = 183.15*** Yes −.09 .05 [−.17, .00] Probabilities Intercept (Changes) 41 .08* .04 [.01, .15] QM (df = 3) = 5.03 QE (df = 37) = 183.67*** Constant −.16 .09 [−.34, .01] Constant (33%) −.10 .10 [−.29, .09] Constant (50%) −.07 .04 [−.15, .00] Payoff Safer Choice Intercept (Changes) 41 .02 .02 [−.02, .06] QM (df = 1) = 0.14 QE (df = 39) = 243.44*** Constant −.01 .03 [−.08, .05] Payoff Riskier Choice Intercept (Changes) 41 .01 .02 [−.02, .05] QM (df = 1) = 0.01 QE (df = 39) = 246.45*** Constant .00 .04 [−.07, .08] Incentivized Intercept (No) 36 −.01 .03 [−.07, .04] QM (df = 2) = 1.52 QE (df = 33) = 158.79*** Random .03 .04 [−.04, .10] Yes .05 .04 [−.03, .13] Risk Averse Choices % Intercept .11 .07 [−.04, .25] QM (df = 1) = 2.36 QE (df = 32) = 119.93*** Risk averse choices % 34 −.00 .00 [−.00, .00] Primary purpose Intercept (No) 41 .01 .02 [−.02, .04] QM (df = 1) = 0.02 QE (df = 39) = 245.51*** Yes .01 .05 [−.09, .10] Beta Imputed Intercept (No) 41 .02 .02 [−.02, .05] QM (df = 1) = 0.30 QE (df = 39) = 245.02*** Yes −.02 .04 [−.11, .06] Note. p < .05 = *, p < .01 = **, p < .001 = ***
Table 7: Moderator Analysis for the Mixed Domain — Males Only.
Moderator K β SE 95% CI Test of Moderators Test of Residual Heterogeneity Sample Type Intercept (CHS) 24 .02 .05 [−.07, .11] QM (df = 2) = 0.65 QE (df = 21) = 66.29*** CS −.03 .06 [−.14, .07] S −.05 .06 [−.17, .07] Avrg. Payment Intercept 3 .19 .14 [−.08, .45] QM (df = 1) = 1.25 QE (df = 1) = 0.06 Avrg. payment −.01 .01 [−.02, .01] CAM Intercept (CATB) 24 .03 .03 [−.04, .09] QM (df = 3) = 2.77 QE (df = 20) = 75.96*** CRT −.08 .05 [−.18, .03] NUM −.10 .09 [−.27, .07] RPM −.03 .05 [−.13, .08] Decision Task Intercept (ALT) 24 −.07 .05 [−.17, .02] QM (df = 7) = 53.31*** QE (df = 16) = 22.82 BLAT −.03 .06 [−.16, .09] CGT .15** .05 [.05, .26] DTB .30*** .07 [.17, .43] GPIT .06 .05 [−.04, .17] IGT .06 .05 [−.04 .16] LT .08 .06 [−.05, .20] MPL .04 .07 [−.10, .19] Certain Option Intercept (No) 24 .11*** .03 [.05, .18] QM (df = 1) = 14.40*** QE (df = 22) = 40.44** Yes −.14*** .04 [−.21, −.07] Probabilities Intercept (Changes) 24 .08* .04 [.00, .15] QM (df = 2) = 5.86* QE (df = 21) = 45.54** Constant (33%) −.10 .09 [−.27 .08] Constant (50%) −.10* .04 [−.19, −.02] Payoff Safer Choice Intercept (Changes) 24 .01 .03 [−.04, .06] QM (df = 1) = 1.13 QE (df = 22) = 73.78*** Constant −.05 .05 [−.14, .04] Payoff Riskier Choice Intercept (Changes) 24 .00 .02 [−.04, .05] QM (df = 1) = 1.10 QE (df = 22) = 83.41*** Constant −.06 .06 [−.18, .06] Incentivized Intercept (No) 21 −.04 .04 [−.13, .04] QM (df = 2) = 1.21 QE (df = 18) = 49.92*** Random .06 .06 [−.05, .18] Yes .05 .06 [−.07, .16] Risk Averse Choices % Intercept 22 .01 .10 [−.19, .21] QM (df = 1) = 0.03 QE (df = 20) = 52.62*** Risk averse choices % −.00 .00 [−.00, .00] Primary purpose Intercept (No) 24 −.00 .02 [−.05, .04] QM (df = 1) = 0.14 QE (df = 22) = 84.38*** Yes −.03 .07 [−.16, .11] Beta Imputed Intercept (No) 24 −.01 .02 [−.05, .04] QM (df = 1) = 0.07 QE (df = 22) = 85.78*** Yes −.03 .10 [−.22, .17] Note. p < .05 = *, p < .01 = **, p < .001 = ***
Table 8: Moderator analysis for the mixed domain — females only.
Moderator K β SE 95% CI Test of Moderators Test of Residual Heterogeneity Sample Type Intercept (CHS) 24 .04 .03 [−.02, .09] QM (df = 2) = 1.35 QE (df = 21) = 36.04* CS .00 .03 [−.06, .07] S −.04 .04 [−.12, .04] Avrg. Payment Intercept 3 .01 .12 [−.21, .24] QM (df = 1) = 0.00 QE (df = 1) = 0.16 Avrg. payment −.00 .01 [−.01, .01] CAM Intercept (CATB) 24 .06*** .01 [.03, .09] QM (df = 3) = 10.72* QE (df = 20) = 28.22 CRT −.08** .03 [−.14, −.02] NUM .04 .06 [−.07, .15] RPM −.05* .03 [−.11, −.00] Decision Task Intercept (ALT) 24 .10* .04 [.02, .19] QM (df = 7) = 34.15*** QE (df = 16) = 11.42 BLAT −.15* .06 [−.27, −.03] CGT −.00 .05 [−.09, .09] DTB .00 .05 [−.10, .11] GPIT −.10* .05 [−.19, −.01] IGT −.07 .04 [−.16, .02] LT −.09 .06 [−.20, .02] MPL −.09 .07 [−.22, .04] Certain Option Intercept (No) 24 .10*** .01 [.07, .13] QM (df = 1) = 23.32*** QE (df = 22) = 22.25 Yes −.08*** .02 [−.11, −.05] Probabilities Intercept (Changes) 24 .10*** .01 [.07, .12] QM (df = 2) = 23.33*** QE (df = 21) = 22.25 Constant (33%) −.12 .06 [−.25, .00] Constant (50%) −.08*** .02 [−.11, −.04] Payoff Safer Choice Intercept (Changes) 24 .02 .02 [−.01, .06] QM (df = 1) = 0.23 QE (df = 22) = 45.18** Constant .01 .03 [−.04, .07] Payoff Riskier Choice Intercept (Changes) 24 .02 .01 [−.01, .05] QM (df = 1) = 0.86 QE (df = 22) = 44.96** Constant .04 .04 [−.04, .12] Incentivized Intercept (No) 21 .05* .02 [.00, .09] QM (df = 2) = 2.22 QE (df = 18) = 23.48 Random −.03 .03 [−.10, .03] Yes −.05 .04 [−.12, .02] Risk Averse Choices % Intercept 22 .02 .09 [−.15, .20] QM (df = 1) = 0.00 QE (df = 20) = 40.84** Risk averse choices % −.00 .00 [−.00, .00] Primary purpose Intercept (No) 24 .03* .01 [.00, .06] QM (df = 1) = 0.36 QE (df = 22) = 41.46** Yes −.03 .04 [−.11, .06] Beta Imputed Intercept (No) 24 .03* .01 [.00, .06] QM (df = 1) = 0.46 QE (df = 22) = 44.62** Yes −.05 .07 [−.19, .09] Note. p < .05 = *, p < .01 = **, p < .001 = ***.
Table 9: Overview of studies included for the domain of losses.
Author Year N Male Female MF-Ratio Payment CAM Probabilities Chapman et al (a) 2018 1000 NA NA NA Yes CATB Constant(0.50) Chen et al 2014 84 43 41 1.049 NA CATB Changes Frey et al 2017 1482 563 919 0.613 Yes CATB Changes Kirchler et al 2017 603 253 350 0.723 Yes CRT Constant(0.50) Koch & Nafziger 2016 643 284 359 0.791 Yes CRT Constant(0.50) Kurnianingsih 2015 33 14 19 0.737 Yes CATB Changes Levin & Hart 2003 30 11 19 0.579 Yes CATB Constant(0.50) Mather et al 2012 157 79 78 1.013 Yes CATB Changes Pachur et al 2017 118 76 42 1.810 Yes CATB Changes Park & Cho 2018 69 35 34 1.029 NA CATB Changes Sytsma et al 2014 190 147 43 3.419 Yes RPM Constant Tymula et al 2013 135 70 65 1.077 Yes CATB Changes Note. Not available (NA), cognitive ability measure (CAM), student sample (S), community sample (CS), children sample (CHS), cognitive ability test battery (CATB), ravens’ progressive matrices (RPM), cognitive reflection task (CRT), multiple price list (MPL), cups task (CT), adaptive lottery task (ALT), lottery task (LT), gift gambling task (GGT), Eckel-Grossman risk task (EGRT).
Table 9, continued
Author Year Incentivized R-Recode Chapman et al (a) 2018 Yes −.015 Chen et al 2014 NA −.237 Frey et al 2017 Random −.052 Kirchler et al 2017 Random .157 Koch & Nafziger 2016 Random .122 Kurnianingsih 2015 Random −.182 Levin & Hart 2003 Yes −.250 Mather et al 2012 Random −.060 Pachur et al 2017 Random −.159 Park & Cho 2018 NA −.055 Sytsma et al 2014 NA −.230 Tymula et al 2013 Random .055 Note. Not available (NA).
Table 10: Moderator analysis for the domain of losses.
Moderator K β SE 95% CI Test of Moderators Test of Residual Heterogeneity MF-Ratio Intercept 11 .06 .07 [−.08, .21] QM (df = 1) = 3.49 QE (df = 9) = 38.71*** MF-Ratio −.09 .05 [−.19, .00] Age Intercept 11 .04 .12 [−.19, .27] QM (df = 1) = 0.70 QE (df = 9) = 44.08*** Avrg. age −.00 .00 [−.01, .00] Sample Type Intercept (CHS) 12 −.26 .22 [−.69, .18] QM (df = 2) = 2.14 QE (df = 9) = 32.01*** CS .18 .23 [−.27, .63] S .28 .23 [−.18, .73] Avrg. Payment Intercept 3 .00 .16 [−.31, .31] QM (df = 1) = 0.34 QE (df = 1) = 8.96** Avrg. payment .01 .01 [−.01, .02] CAM Intercept (CATB) 12 −.05** .02 [−.08, −.01] QM (df = 2) = 41.50*** QE (df = 9) = 9.13 CRT .19*** .03 [.12, .25] RPM −.19* .08 [−.33, −.04] Decision Task Intercept (ALT) 12 −.05 .11 [−.27, .16] QM (df = 5) = 6.61 QE (df = 6) = 23.61*** CT −.19 .19 [−.56, .18] EGRT −.18 .17 [−.51, .15] GGT −.20 .25 [−.68, .28] LT .04 .12 [−.20, .29] MPL .10 .14 [−.16, .37] Certain Option Intercept (No) 12 −.05 .13 [−.32, .21] QM (df = 2) = 0.34 QE (df = 9) = 41.16*** Yes .02 .15 [−.27, .30] Yes/No −.06 .18 [−.40, .29] Probabilities Intercept (Changes) 12 −.08 .04 [−.16, .00] QM (df = 2) = 10.36** QE (df = 9) = 22.59** Constant −.16 .11 [−.37, .06] Constant (50%) .15* .06 [.03, .27] Payoff Safer Choice Intercept (Changes) 12 −.00 .04 [−.09, .08] QM (df = 1) = 2.96 QE (df = 10) = 40.93*** Constant −.15 .09 [−.32, .02] Payoff Riskier Choice Intercept (Changes) 12 −.10* .04 [−.18, −.02] QM (df = 1) = 7.05** QE (df = 10) = 27.71** Constant .17** .06 [.04, .30] Incentivized Intercept (Random) 9 .01 .05 [−.08, .11] QM (df = 1) = 0.47 QE (df = 7) = 33.48*** Yes −.07 .11 [−.29, .14] Risk Averse Choices % Intercept 7 .21 .18 [−.15, .57] QM (df = 1) = 1.91 QE (df = 5) = 15.78** Risk averse choices % −.00 .00 [−.01, .00] Primary purpose Intercept (No) 12 −.00 .04 [−.09, .08] QM (df = 1) = 3.27 QE (df = 10) = 42.34*** Yes −.17 .09 [−.34, .01] Beta Imputed Intercept (No) 12 −.04 .05 [−.13, .06] QM (df = 1) = 0.29 QE (df = 10) = 46.45*** Yes −.06 .11 [−.28, .16] Note. p < .05 = *, p < .01 = **, p < .001 = ***
Table 11: Moderator analysis for the domain of losses — males only.
Moderator K β SE 95% CI Test of Moderators Test of Residual Heterogeneity Sample Type Intercept (S) 8 −.02 .10 [−.23, .18] QM (df = 1) = 0.13 QE (df = 6) = 28.58*** CS −.05 .15 [−.34, .24] CAM Intercept (CATB) 8 −.07 .07 [−.21, .08] QM (df = 2) = 4.77 QE (df = 5) = 12.64* CRT .17 .12 [−.06, .41] RPM −.19 .16 [−.52, .13] Decision Task Intercept (ALT) 8 .01 .04 [−.08, .09] QM (df = 4) = 28.18*** QE (df = 3) = 1.01 CT −.49** .16 [−.81, −.17] EGRT −.27** .09 [−.45, −.08] LT .02 .06 [−.11, .14] MPL .17* .07 [.03, .31] Certain Option Intercept (No) 8 .01 .21 [−.40, .42] QM (df = 2) = 0.53 QE (df = 5) = 29.05*** Yes −.11 .23 [−.56, .35] Yes/No .02 .27 [−.50, .55] Probabilities Intercept (Changes) 8 −.07 .07 [−.21, .08] QM (df = 2) = 4.77 QE (df = 5) = 12.64* Constant −.19 .16 [−.52, .13] Constant (50%) .17 .12 [−.06, .41] Payoff Safer Choice Intercept (Changes) 8 .05 .04 [−.02, .13] QM (df = 1) = 15.40*** QE (df = 6) = 8.44 Constant −.37*** .09 [−.56, −.19] Payoff Riskier Choice Intercept (Changes) 8 −.11 .07 [−.25, .03] QM (df = 1) = 2.83 QE (df = 6) = 19.77** Constant .22 .13 [−.04, .47] Risk Averse Choices % Intercept 6 .02 .32 [−.61, .64] QM (df = 1) = 0.02 QE (df = 4) = 17.02** Risk averse choices % −.00 .00 [−.01, .01] Primary purpose Intercept (No) 8 .01 .08 [−.14, .16] QM (df = 1) = 1.92 QE (df = 6) = 24.36*** Yes −.20 .14 [−.48, .08] Beta Imputed Intercept (No) 8 −.00 .06 [−.13, .12] QM (df = 1) = 2.25 QE (df = 6) = 17.93** Yes −.26 .17 [−.59, .08] Note. p < .05 = *, p < .01 = **, p < .001 = ***. Data available for the domain of losses was insufficient to investigate the influence of average payment as well as the incentive structure of the decision task used to measure risk aversion for males only.
Table 12: Moderator analysis for the domain of losses — females only.
Moderator K β SE 95% CI Test of Moderators Test of Residual Heterogeneity Sample Type Intercept (S) 8 .11** .04 [.03, .18] QM (df = 1) = 13.40*** QE (df = 6) = 4.08 CS −.18*** .05 [−.28, −.09] CAM Intercept (CATB) 8 −.08* .03 [−.14, −.02] QM (df = 2) = 15.50*** QE (df = 5) = 3.04 CRT .19*** .05 [.10, .29] RPM .08 .16 [−.24, .40] Decision Task Intercept (ALT) 8 −.06 .15 [−.35, .22] QM (df = 4) = 1.33 QE (df = 3) = 8.47* CT −.15 .26 [−.66, .36] EGRT .07 .26 [−.44, .57] LT .06 .17 [−.28, .39] MPL .14 .21 [−.27, .55] Certain Option Intercept (No) 8 −.06 .07 [−.20, .07] QM (df = 2) = 4.84 QE (df = 5) = 6.50 Yes .13 .08 [−.03, .30] Yes/No −.08 .12 [−.32, .16] Probabilities Intercept (Changes) 8 −.08* .03 [−.14, −.02] QM (df = 2) = 15.50*** QE (df = 5) = 3.05 Constant .08 .16 [−.24, .40] Constant (50%) .19*** .05 [.10, .29] Payoff Safer Choice Intercept (Changes) 8 .01 .05 [−.10, .11] QM (df = 1) = 0.60 QE (df = 6) = 18.22** Constant −.11 .14 [−.39, .17] Payoff Riskier Choice Intercept (Changes) 8 −.07* .03 [−.13, −.01] QM (df = 1) = 15.82*** QE (df = 6) = 3.28 Constant .19*** .05 [.10, .28] Risk Averse Choices % Intercept 6 .34** .11 [.12, .56] QM (df = 1) = 6.31* QE (df = 4) = 5.33 Risk averse choices % −.01* .00 [−.01, −.00] Primary purpose Intercept (No) 8 .03 .05 [−.07, .13] QM (df = 1) = 2.20 QE (df = 6) = 16.38* Yes −.18 .12 [−.41, .06] Beta Imputed Intercept (No) 8 −.01 .05 [−.12, .09] QM (df = 1) = 0.01 QE (df = 6) = 19.10** Yes .02 .20 [−.37, .40] Note. p < .05 = *, p < .01 = **, p < .001 = ***. Data available for the domain of losses was insufficient to investigate the influence of average payment as well as the incentive structure of the decision task used to measure risk aversion for females only.
Copyright: © 2019. The authors license this article under the terms of the Creative Commons Attribution 3.0 License.
This document was translated from LATEX by HEVEA.