Keywords: risk attitude, risk perception, risk taking, personality, psychometric scale.
| English | French | Total | ||
| Variable | Characteristic | (n=172) | (n=187) | (n=359) |
| Gender | Male | 90 | 101 | 191 |
| Female | 82 | 86 | 168 | |
| Age | 18-21 | 38 | 51 | 89 |
| 22-35 | 102 | 124 | 226 | |
| > 35 | 32 | 12 | 44 | |
| Education level | Less than college degree | 50 | 50 | 100 |
| College degree | 84 | 80 | 164 | |
| Postgraduate degree | 38 | 57 | 95 | |
| DOSPERT score | Overall (n = 359) | English (n = 172) | French (n = 187) | ||||||
| M | SD | a | M | SD | a | M | SD | a | |
| Risk perception | |||||||||
| 1. Ethical | 27.39 | 6.59 | .67 | 26.70a | 6.40 | .74 | 28.03a | 4.84 | .62 |
| 2. Financial | 26.53 | 7.73 | .78 | 25.34a | 7.36 | .83 | 27.64b | 5.24 | .68 |
| 3. Health/Safety | 28.15 | 7.43 | .70 | 27.03a | 6.62 | .74 | 29.17b | 5.04 | .62 |
| 4. Recreational | 27.17 | 9.14 | .75 | 25.84a | 6.94 | .79 | 28.39b | 5.34 | .68 |
| 5. Social | 17.01 | 5.69 | .76 | 16.42a | 6.70 | .83 | 17.56a | 5.07 | .66 |
| Risk taking | |||||||||
| 1. Ethical | 16.92 | 6.59 | .68 | 17.97a | 7.16 | .75 | 15.96b | 5.87 | .61 |
| 2. Financial | 19.61 | 7.73 | .80 | 20.67a | 8.51 | .83 | 18.64a | 6.81 | .77 |
| 3. Health/Safety | 20.63 | 7.43 | .66 | 21.80a | 7.84 | .71 | 19.56b | 6.88 | .61 |
| 4. Recreational | 22.43 | 9.14 | .84 | 23.01a | 9.40 | .86 | 21.90a | 8.89 | .82 |
| 5. Social | 32.58 | 5.69 | .70 | 32.42a | 6.44 | .79 | 32.72a | 4.92 | .57 |
| Note: Minimum and maximum scores are 6 and 42, respectively. Means with different subscripts differ significantly at p < .005 (two-tailed). |
| Model 1 | Model 2 | Model 3 | |||||||
| B | SE(B) | B | SE(B) | b | B | SE(B) | b | ||
| Fixed Effect | |||||||||
| Intercept | 22.49 | 0.27 | 22.22 | 0.24 | 21.98 | 0.34 | |||
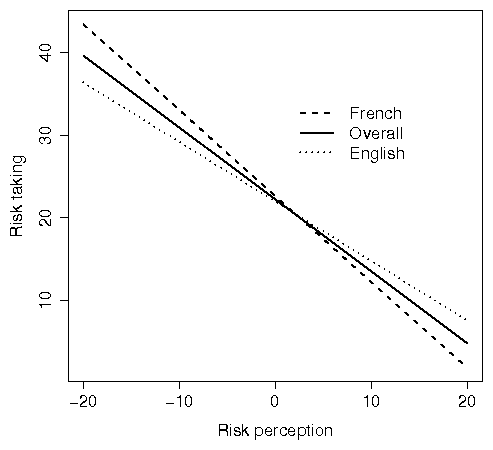
| Risk perception | -0.87 | 0.03 | -.70 | -0.72 | 0.04 | -.58 | |||
| Group | 0.64 | 0.47 | .04 | ||||||
| Group-by-perception | -0.32 | 0.06 | -.17 | ||||||
| Random Effect | |||||||||
| Within-individual variance | 72.80 | 2.72 | 30.06 | 1.24 | 30.00 | 1.23 | |||
| Between-individuals variance | |||||||||
| Intercept | 10.78 | 1.97 | 12.66 | 1.51 | 12.10 | 1.46 | |||
| Slope "Risk perception" | 0.14 | 0.02 | 0.12 | 0.02 | |||||
| Deviance | 12989.34 | 11807.05 | 11768.00 | ||||||
| Note: The fixed effects represent the average intercept and slopes, as in conventional OLS regression analysis. The random effects signify the within-individual, intercept, and slope variances. For each predictor variable, we show its regression coefficient (B), the standard error of B, and the standardized regression coefficient (b). p > .05. |
| Variable | B | SE(B) | b | B | SE(B) | b |
| (a) Risk perception | ||||||
| 1. Ethical | -0.71 | 0.09 | -.61 | -0.09 | 0.09 | -.08 |
| 2. Financial | -0.66 | 0.10 | -.55 | -0.32 | 0.09 | -.27 |
| 3. Health/Safety | -0.92 | 0.09 | -.74 | -0.28 | 0.09 | -.22 |
| 4. Recreational | -1.17 | 0.10 | -.80 | -0.54 | 0.10 | -.37 |
| 5. Social | -0.49 | 0.08 | -.51 | -0.22 | 0.07 | -.22 |
| (b) Group-by-perception | ||||||
| 1. Ethical | 0.62 | 0.12 | .42 | |||
| 2. Financial | 0.34 | 0.12 | .23 | |||
| 3. Health/Safety | 0.64 | 0.12 | .40 | |||
| 4. Recreational | 0.63 | 0.13 | .33 | |||
| 5. Social | 0.27 | 0.10 | .22 | |||
| Risk taking, English | ||||||
| 1 | 2 | 3 | 4 | 5 | 6 | 7 |
| Extremely | Moderately | Somewhat | Not Sure | Somewhat | Moderately | Extremely |
| Unlikely | Unlikely | Unlikely | Likely | Likely | Likely | |
| Risk perception, English | ||||||
| 1 | 2 | 3 | 4 | 5 | 6 | 7 |
| Not at all | Slightly | Somewhat | Moderately | Risky | Very | Extremely |
| Risky | Risky | Risky | Risky | Risky | Risky | |
| Risk taking, French | ||||||
| 1 | 2 | 3 | 4 | 5 | 6 | 7 |
| Extrêmement | Modérément | Assez | Incertain(e) | Assez | Moyennement | Extrêmement |
| Peu Probable | Peu Probable | Peu Probable | Probable | Probable | Probable | |
| Risk perception, French | ||||||
| 1 | 2 | 3 | 4 | 5 | 6 | 7 |
| Pas Du Tout | Très Peu | Peu | Modérément | Risquée | Très | Extrêmement |
| Risquée | Risquée | Risquée | Risquée | Risquée | Risquée | |